Accumulo 2.x Documentation >> Administration >> Monitoring & Metrics
Monitoring & Metrics
Edit this pageMonitoring
Accumulo Monitor
The Accumulo Monitor provides a web UI with information on the health and status of Accumulo.
The monitor can be viewed at:
- http://localhost:9995 - if Accumulo is running locally (for development)
http://<MONITOR_HOST>:9995/- if Accumulo is running on a cluster
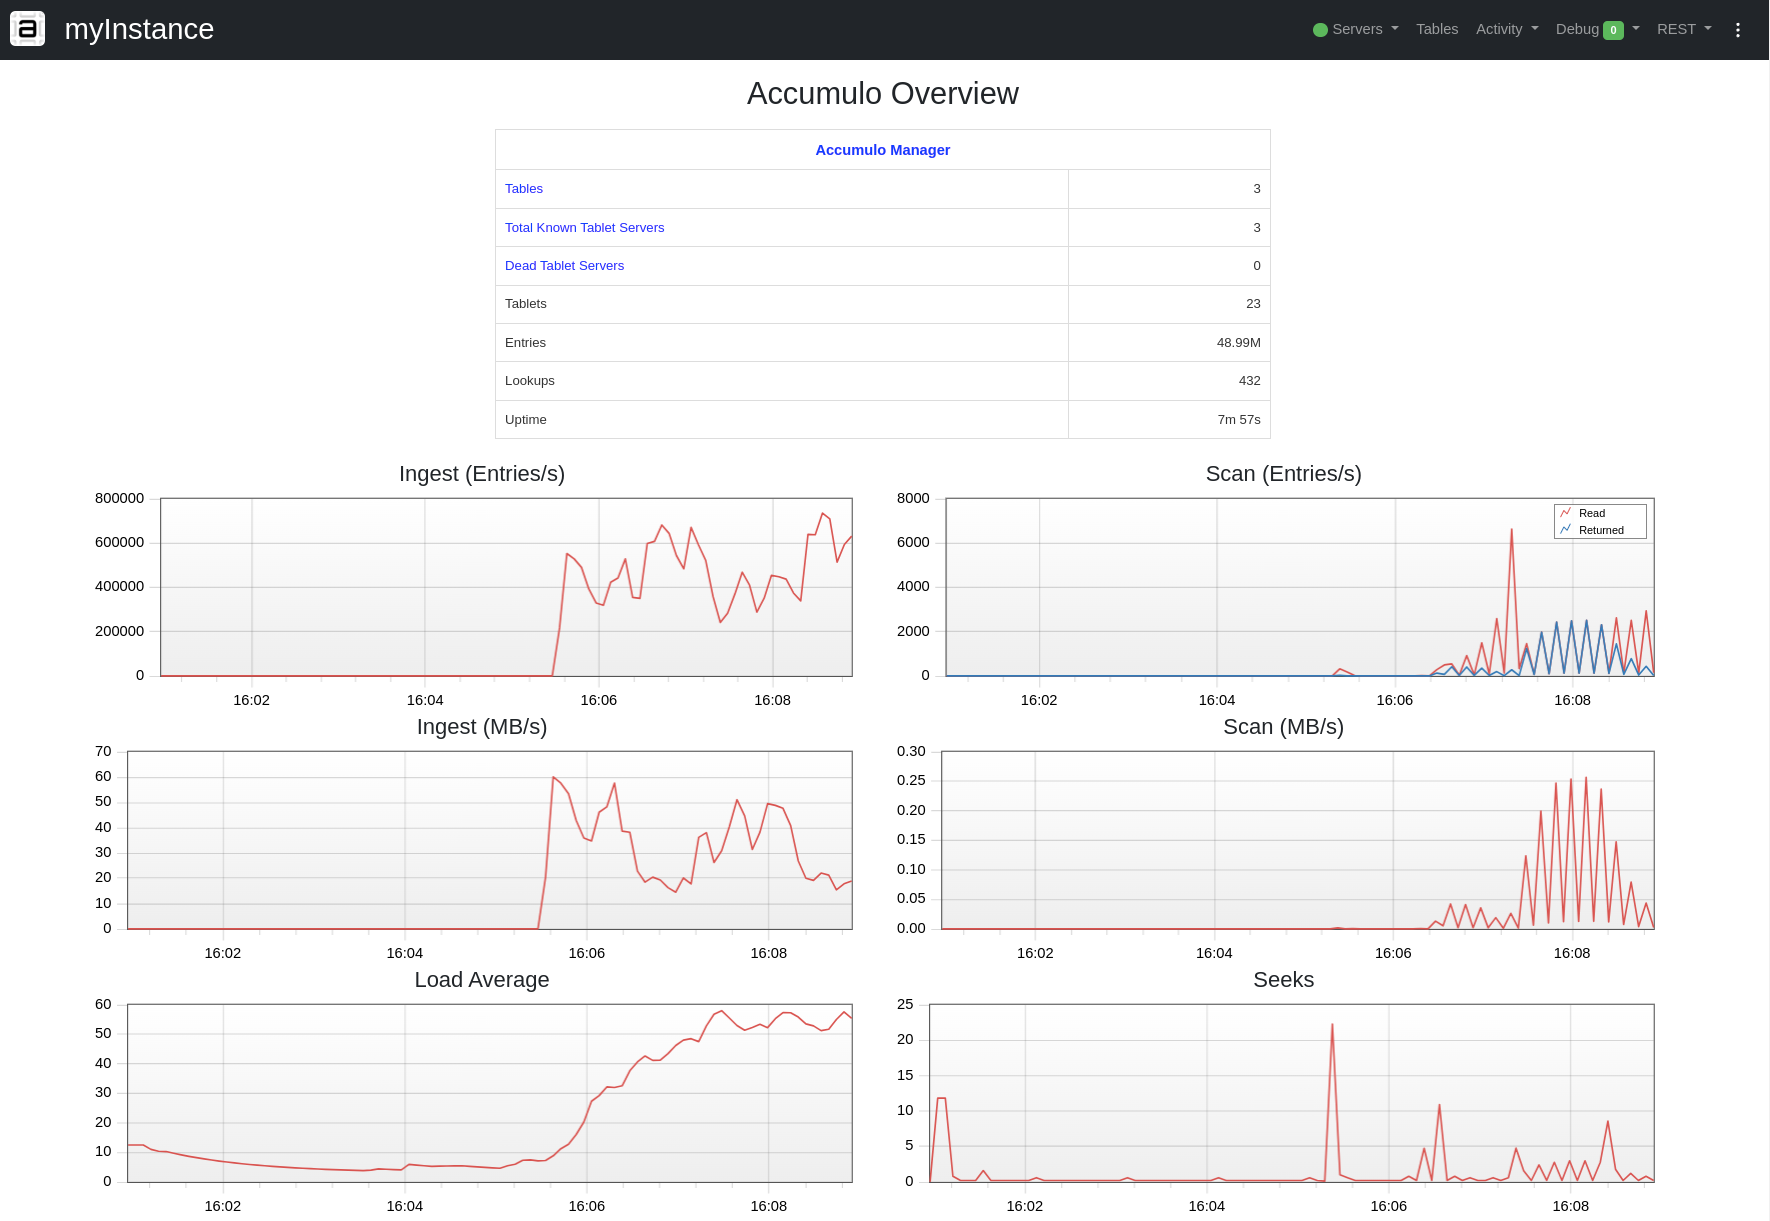
The Overview page (shown below) contains some summary information about the Accumulo instance and graphs displaying various metrics over time. These include ingest and scan performance and other useful measurements.
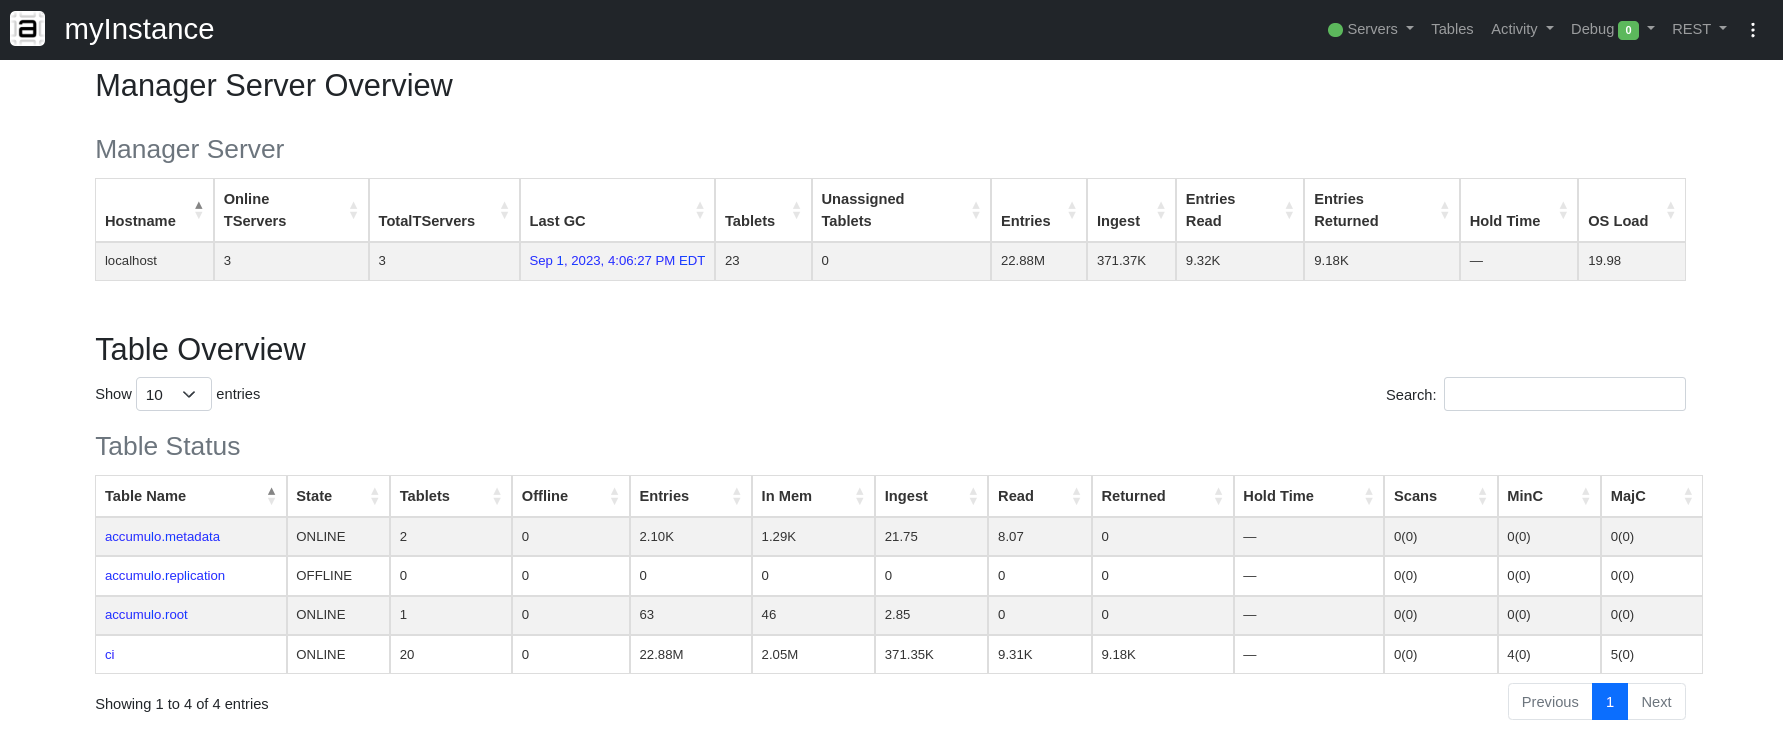
The Manager Server, Tablet Servers, and Tables pages display metrics grouped in different ways (e.g. by tablet server or by table). Metrics typically include number of entries (key/value pairs), ingest and query rates. The number of running scans, major and minor compactions are in the form number_running (number_queued). Another important metric is hold time, which is the amount of time a tablet has been waiting but unable to flush its memory in a minor compaction.
The Server Activity page graphically displays tablet server status, with each server represented as a circle or square. Different metrics may be assigned to the nodes’ color and speed of oscillation. The Overall Avg metric is only used on the Server Activity page, and represents the average of all the other metrics (after normalization). Similarly, the Overall Max metric picks the metric with the maximum normalized value.
The Garbage Collector page displays a list of garbage collection cycles, the number of files found of each type (including deletion candidates in use and files actually deleted), and the length of the deletion cycle. The Traces page displays data for recent traces performed (see the following section for information on tracing). The Recent Logs page displays warning and error logs forwarded to the monitor from all Accumulo processes. Also, the XML and JSON links provide metrics in XML and JSON formats, respectively.
The Accumulo monitor does a best-effort to not display any sensitive information to users; however, the monitor is intended to be a tool used with care. It is not a production-grade webservice. It is a good idea to whitelist access to the monitor via an authentication proxy or firewall. It is strongly recommended that the Monitor is not exposed to any publicly-accessible networks.
Things highlighted in yellow may be in need of attention. If anything is highlighted in red on the monitor page, it is something that definitely needs attention.
SSL
SSL may be enabled for the monitor page by setting the following properties in the accumulo.properties file:
- monitor.ssl.keyStore
- monitor.ssl.keyStorePassword
- monitor.ssl.trustStore
- monitor.ssl.trustStorePassword
If the Accumulo conf directory has been configured (in particular the accumulo-env.sh file must be set up), the
accumulo-util gen-monitor-cert command can be used to create the keystore and truststore files with random passwords. The command
will print out the properties that need to be added to the accumulo.properties file. The stores can also be generated manually with the
Java keytool command, whose usage can be seen in the accumulo-util script.
If desired, the SSL ciphers allowed for connections can be controlled via the following properties in accumulo.properties:
If SSL is enabled, the monitor URL can only be accessed via https. This also allows you to access the Accumulo shell through the monitor page. The left navigation bar will have a new link to Shell. An Accumulo user name and password must be entered for access to the shell.
Metrics
Accumulo can emit metrics using the Micrometer library. Support for the Hadoop Metrics2 framework was removed in version 2.1.0.
Configuration
Micrometer supports sending metrics to multiple monitoring systems. A Metrics sink in Micrometer is called a
Meter Registry. To enable this feature you need to set the property general.micrometer.enabled to true and
optionally set general.micrometer.jvm.metrics.enabled to true to include jvm metrics. Accumulo provides a
mechanism for the user to specify which Meter Registry it should use with the property general.micrometer.factory.
The value for this property should be the name of a class that implements
MeterRegistryFactory.
Each server process should have log messages from the org.apache.accumulo.core.metrics.MetricsUtil class that details whether or not metrics are enabled and which MeterRegistryFactory class has been configured. Be sure to check the Accumulo processes log files when debugging missing metrics output.
Metric Names
See the javadoc for MetricsProducer for a list of metric names that will be emitted and a mapping to their prior names when Accumulo was using Hadoop Metrics2.