Does a compactor process return memory to the OS?
Author: Dominic Garguilo, Kevin Rathbun
Date: 09 Apr 2024
Goal
The goal of the project was to determine if, once an Accumulo process is finished using memory, the JVM would release this unused memory back to the operating system. This was specifically observed in a Compactor process during the tests, but the findings should apply to any Accumulo Server process. We looked at the memory usage of the compactor process specifically to help understand if oversubscribing compactors on a machine is a viable option.
As background information, it’s important to note that modern JVMs are expected to release memory back to the operating system, rather than just growing from the initial heap size (-Xms) to the maximum heap size (-Xmx) and never releasing it. This behavior was introduced in Java 11 through the JEP 346: Promptly Return Unused Committed Memory from G1. This feature aims to improve the efficiency of memory usage by actively returning Java heap memory to the operating system when idle.
Test Scenario
There could be a scenario where the amount of memory on a machine limits the number of compactors that can be run. For example, on a machine with 32GB of memory, if each compactor process uses 6GB of memory, we can only “fit” 5 compactors on that machine (32/6=5.333). Since each compactor process only runs on a single core, we would only be utilizing 5 cores on that machine where we would like to be using as many as we can.
If the compactor process does not return the memory to the OS, then we are stuck with only using the following number of compactor processes:
(total memory)/(memory per compactor).
If the compactor processes return the memory to the OS, i.e. does not stay at the maximum 6GB once they reach it, then we can oversubscribe the memory allowing us to run more compactor processes on that machine.
It should be noted that there is an inherent risk when oversubscribing processes that the user must be willing to accept if they choose to do oversubscribe. In this case, there is the possibility that all compactors run at the same time which might use all the memory on the machine. This could cause one or more of the compactor processes to be killed by the OOM killer.
Test Setup
Environment Prerequisites
The machines used for testing were running Pop!_OS 22.04 a debian-based OS. The following package installation and usage steps may vary if one were try to repeat these steps.
Install gnuplot
This was used for plotting the memory usage of the compactor over time from the perspective of the OS
sudo apt install gnuplot- gnuplot was started with the command
gnuplot
Install VisualVM
This was used for plotting the memory usage of the compactor over time from the perspective of the JVM
- Downloaded the zip from visualvm.github.io
- Extracted with
unzip visualvm_218.zip - VisualVM was started with the command
./path/to/visualvm_218/bin/visualvm
Configure and start accumulo
Accumulo 2.1 was used for experimentation. To stand up a single node instance, fluo-uno was used.
Steps taken to configure accumulo to start compactors:
- Uncommented lines in
fluo-uno/install/accumulo-2.1.2/conf/cluster.yamlregarding the compaction coordinator and compactor q1. A single compactor process was used, q1. This allows the external compaction processes to start up. - Configured the java args for the compactor process in “accumulo-env.sh.” Line:
compactor) JAVA_OPTS=('-Xmx256m' '-Xms256m' "${JAVA_OPTS[@]}") ;; - Started accumulo with
uno start accumulo
Install java versions
- Installed java versions 11, 17 and 21. For example, Java 17 was installed with:
sudo apt install openjdk-17-jdksudo update-alternatives --config javaand select the intended version before starting the accumulo instance- Ensured
JAVA_HOMEwas set to the intended version of java before each test run
Running the test
- Started accumulo using fluo-uno (after changing the mentioned configuration)
uno start accumulo
- Opened VisualVM and selected the running compactor q1 process taking note of the PID
- Ran
mem_usage_script.sh <compactor process PID>. This collected measurements of memory used by the compactor process over time from the perspective of the OS. We let this continue to run while the compaction script was running. - Configured the external compaction script as needed and executed:
uno jshell experiment.jsh
- Memory usage was monitored from the perspective of the JVM (using VisualVM) and from the perspective of the OS (using our collection script). Navigated to the “Monitor” tab of the compactor in VisualVM to see the graph of memory usage from JVM perspective. Followed the info given in the OS Memory Data Collection Script section to plot the memory usage from OS perspective.
Helpful resources:
- External Compactions accumulo blog post
- Z garbage collector heap size docs
- Generational Garbage Collection docs
- G1 garbage collector docs
- Java 11 and memory release article
External compaction test script
Initiates an external compaction of 700MB of data (20 files of size 35MB) on Compactor q1.
referred to as experiment.jsh in the test setup section
import org.apache.accumulo.core.conf.Property;

int dataSize = 35_000_000;
byte[] data = new byte[dataSize];
Arrays.fill(data, (byte) 65);
String tableName = "testTable";

void ingestAndCompact() throws Exception {
   try {
       client.tableOperations().delete(tableName);
   } catch (TableNotFoundException e) {
       // ignore
   }

   System.out.println("Creating table " + tableName);
   client.tableOperations().create(tableName);

   // This is done to avoid system compactions, we want to initiate the compactions manually
   client.tableOperations().setProperty(tableName, Property.TABLE_MAJC_RATIO.getKey(), "1000");
   // Configure for external compaction
   client.instanceOperations().setProperty("tserver.compaction.major.service.cs1.planner","org.apache.accumulo.core.spi.compaction.DefaultCompactionPlanner");
   client.instanceOperations().setProperty("tserver.compaction.major.service.cs1.planner.opts.executors","[{\"name\":\"large\",\"type\":\"external\",\"queue\":\"q1\"}]");

   client.tableOperations().setProperty(tableName, "table.compaction.dispatcher", "org.apache.accumulo.core.spi.compaction.SimpleCompactionDispatcher");
   client.tableOperations().setProperty(tableName, "table.compaction.dispatcher.opts.service", "cs1");

   int numFiles = 20;

   try (var writer = client.createBatchWriter(tableName)) {
       for (int i = 0; i < numFiles; i++) {
           Mutation mut = new Mutation("r" + i);
           mut.at().family("cf").qualifier("cq").put(data);
           writer.addMutation(mut);
           writer.flush();

           System.out.println("Writing " + dataSize + " bytes to a single value");
           client.tableOperations().flush(tableName, null, null, true);
       }
   }

   System.out.println("Compacting table");
   client.tableOperations().compact(tableName, new CompactionConfig().setWait(true));
   System.out.println("Finished table compaction");
}

ingestAndCompact();
// Optionally sleep and ingestAndCompact() again, or just execute the script again.
OS Memory Data Collection Script
Tracks the Resident Set Size (RSS) of the given PID over time, outputting the data to output_mem_usage.log. Data is taken every 5 seconds for an hour or until stopped.
referred to as mem_usage_script.sh in the test setup section
#!/bin/bash
PID=$1
echo "Tracking PID: $PID"
DURATION=3600 # for 1 hour
INTERVAL=5    # every 5 seconds
rm output_mem_usage.log

while [ $DURATION -gt 0 ]; do
    ps -o %mem,rss -p $PID | tail -n +2 >> output_mem_usage.log
    sleep $INTERVAL
    DURATION=$((DURATION - INTERVAL))
done
After compactions have completed plot the data using gnuplot:
gnuplot
set title "Resident Set Size (RSS) Memory usage"
set xlabel "Time"
set ylabel "Mem usage in kilobytes"
plot "output_mem_usage.log" using ($0*5):2 with lines title 'Mem usage'
Data
Important Notes:
- ZGC and G1PeriodicGCInterval are not available with Java 11, so couldn’t be tested for
- ZGenerational for ZGC is only available in Java 21, so couldn’t be tested for in Java 17
- G1 GC is the default GC in Java 11, 17, and 21 (doesn’t need to be specified in java args)
All Experiments Performed:
| Java Version | Manual Compaction | Xmx=1G | Xmx=2G | Xms=256m | XX:G1PeriodicGCInterval=60000 | XX:-G1PeriodicGCInvokesConcurrent | XX:+UseShenandoahGC | XX:+UseZGC | XX:ZUncommitDelay=120 | XX:+ZGenerational |
|---|---|---|---|---|---|---|---|---|---|---|
| 11 | 🗸 | 🗸 | 🗸 | |||||||
| 11 | 🗸 | 🗸 | 🗸 | |||||||
| 11 | 🗸 | 🗸 | ||||||||
| 11 | 🗸 | 🗸 | 🗸 | |||||||
| 17 | 🗸 | 🗸 | 🗸 | |||||||
| 17 | 🗸 | 🗸 | 🗸 | |||||||
| 17 | 🗸 | 🗸 | 🗸 | 🗸 | ||||||
| 17 | 🗸 | 🗸 | 🗸 | 🗸 | ||||||
| 17 | 🗸 | 🗸 | 🗸 | |||||||
| 17 | 🗸 | 🗸 | 🗸 | |||||||
| 21 | 🗸 | 🗸 | 🗸 | |||||||
| 21 | 🗸 | 🗸 | 🗸 | 🗸 | 🗸 | |||||
| 21 | 🗸 | 🗸 | 🗸 | 🗸 | ||||||
| 21 | 🗸 | 🗸 | 🗸 | |||||||
| 21 | 🗸 | 🗸 | 🗸 |
Java 11 G1 GC with manual GC (via VisualVM) every minute. Java args: -Xmx1G -Xms256m
Java 11 G1 GC with manual GC (via VisualVM) after each compaction. Java args: -Xmx1G -Xms256m
Java 11 G1 GC. Java args: -Xmx2G -Xms256
Java 11 Shenandoah GC. Java args: -Xmx2G -Xms256 -XX:+UseShenandoahGC
Java 17 G1 GC. Java args: -Xmx1G -Xms256m -XX:G1PeriodicGCInterval=60000
Java 17 G1 GC. Java args: -Xmx2G -Xms256m -XX:G1PeriodicGCInterval=60000
Java 17 G1 GC. Java args: -Xmx1G -Xms256m -XX:G1PeriodicGCInterval=60000 -XX:-G1PeriodicGCInvokesConcurrent
Java 17 ZGC. Java args: -Xmx2G -Xms256m -XX:+UseZGC -XX:ZUncommitDelay=120
Java 17 Shenandoah GC. Java args: -Xmx1G -Xms256m -XX:+UseShenandoahGC
Java 17 Shenandoah GC. Java args: -Xmx2G -Xms256m -XX:+UseShenandoahGC
Java 21 G1 GC. Java args: -Xmx2G -Xms256m -XX:G1PeriodicGCInterval=60000
Java 21 ZGC. Java args: -Xmx2G -Xms256m -XX:+UseZGC -XX:+ZGenerational -XX:ZUncommitDelay=120
Java 21 ZGC. Java args: -Xmx2G -Xms256m -XX:+UseZGC -XX:ZUncommitDelay=120
Java 21 Shenandoah GC. Java args: -Xmx1G -Xms256m -XX:+UseShenandoahGC
Java 21 Shenandoah GC. Java args: -Xmx2G -Xms256m -XX:+UseShenandoahGC
Conclusion
All the garbage collectors tested (G1 GC, Shenandoah GC, and ZGC) and all the Java versions tested (11, 17, 21) will release memory that is no longer used by a compactor, back to the OS*. Regardless of which GC is used, after an external compaction is done, most (but usually not all) memory is eventually released back to the OS and all memory is released back to the JVM. Although a comparable amount of memory is returned to the OS in each case, the amount of time it takes for the memory to be returned and the amount of memory used during a compaction depends on which garbage collector is used and which parameters are set for the java process.
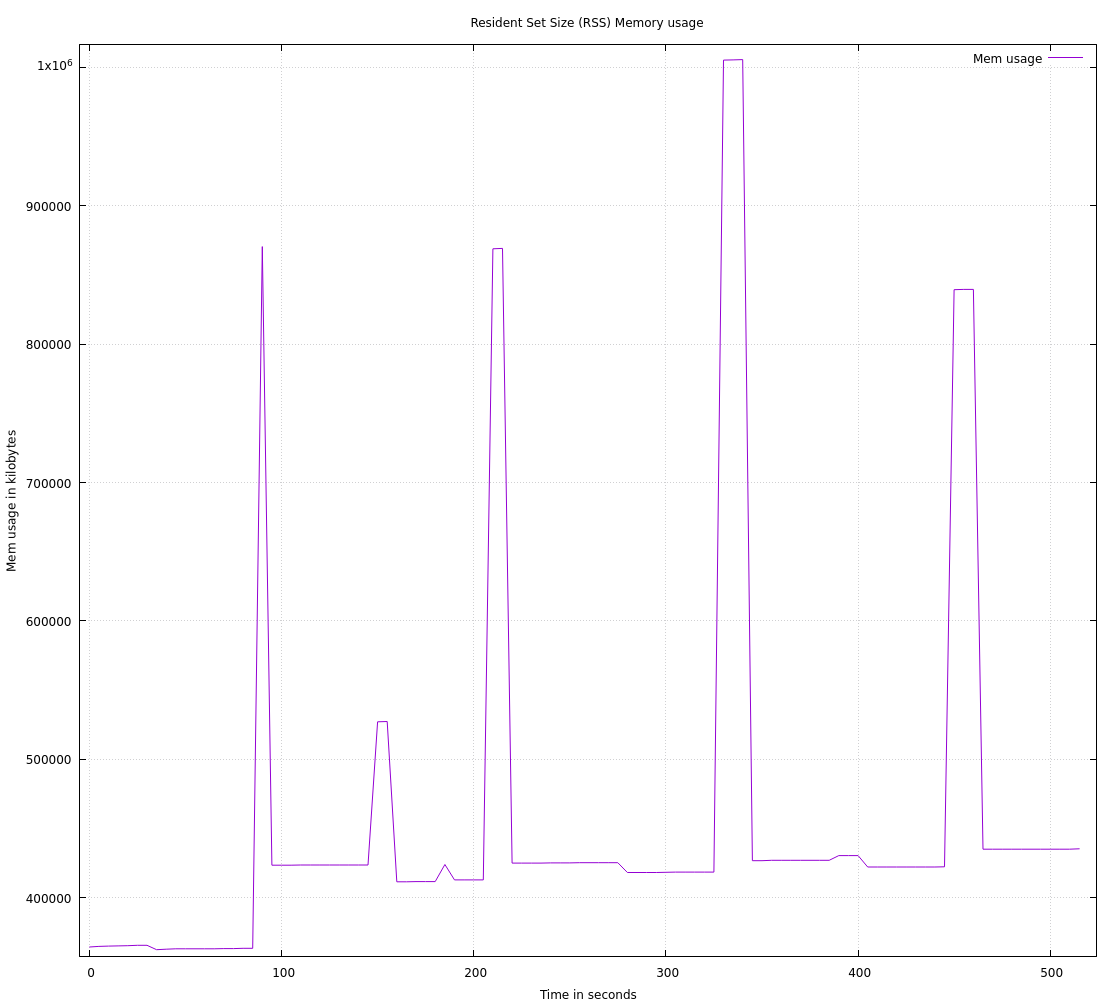
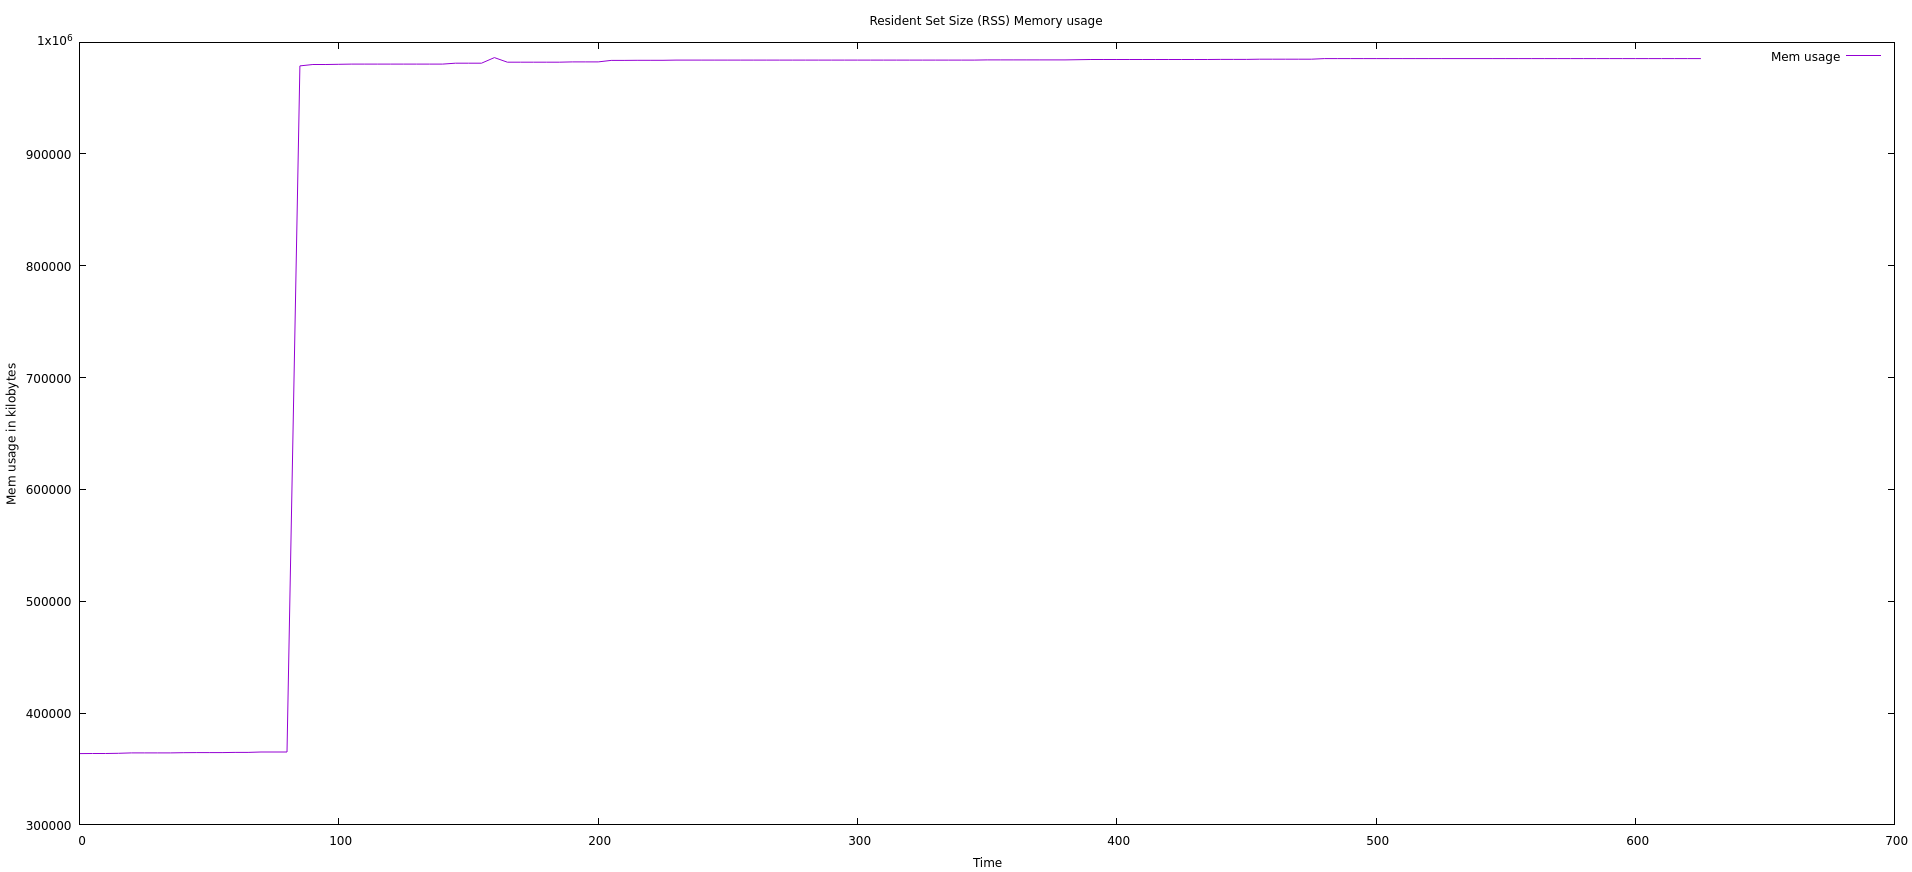
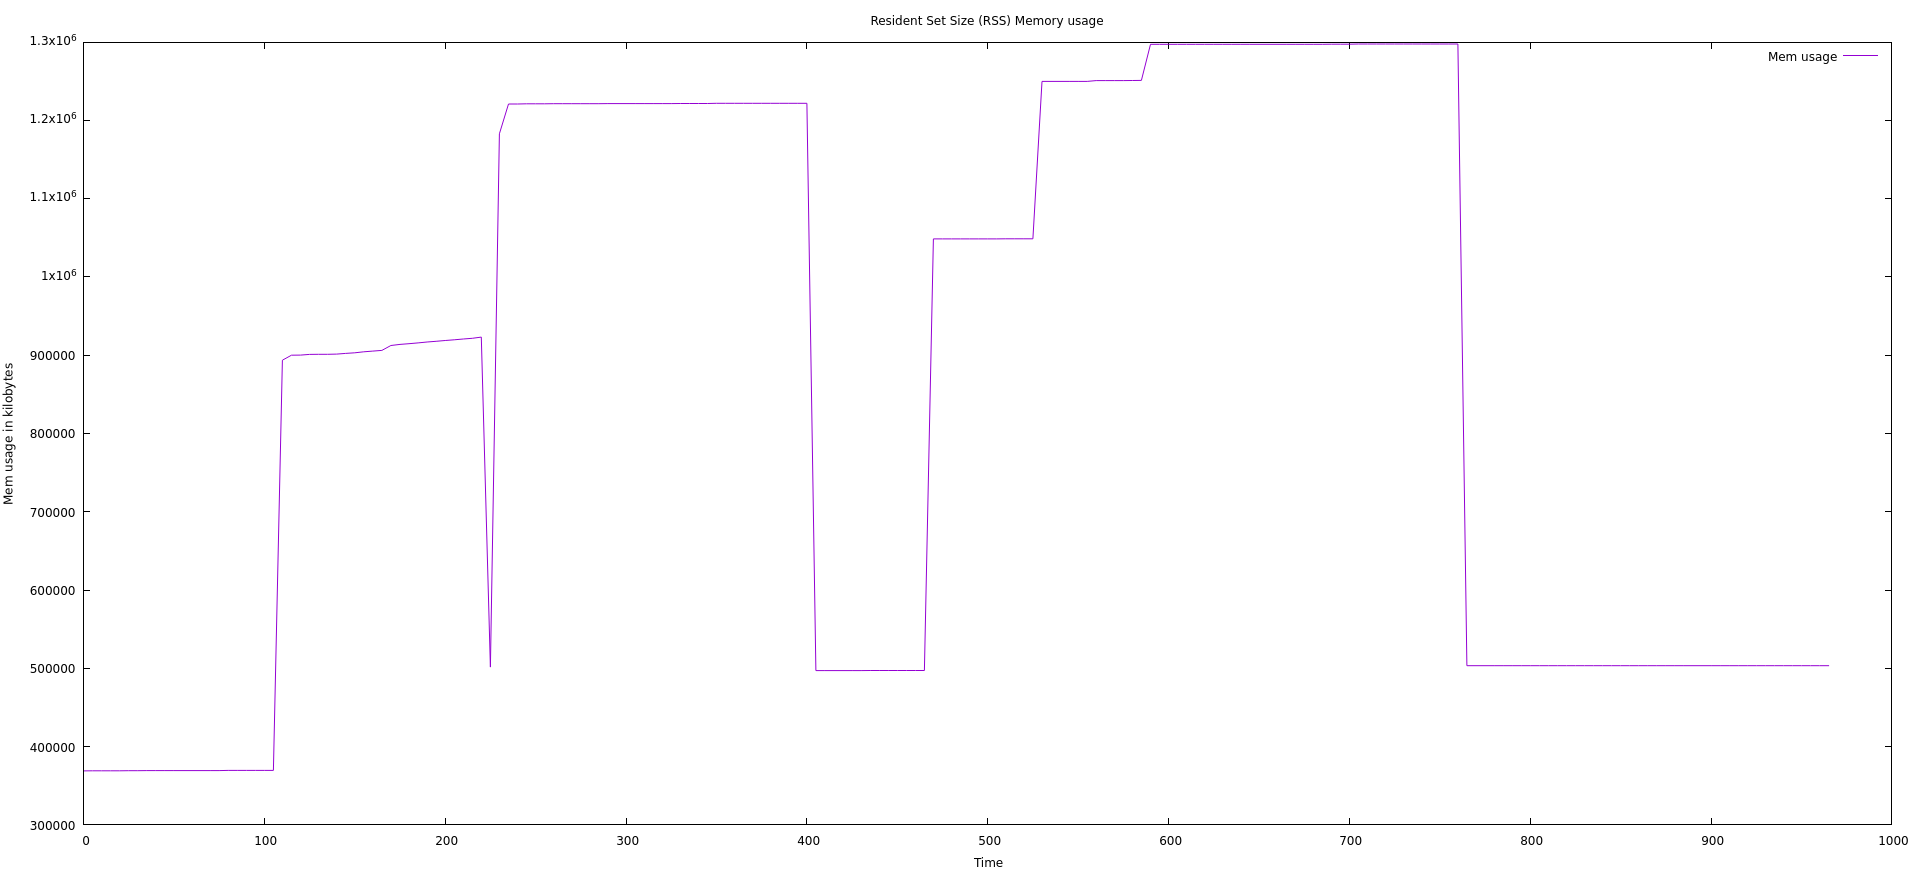
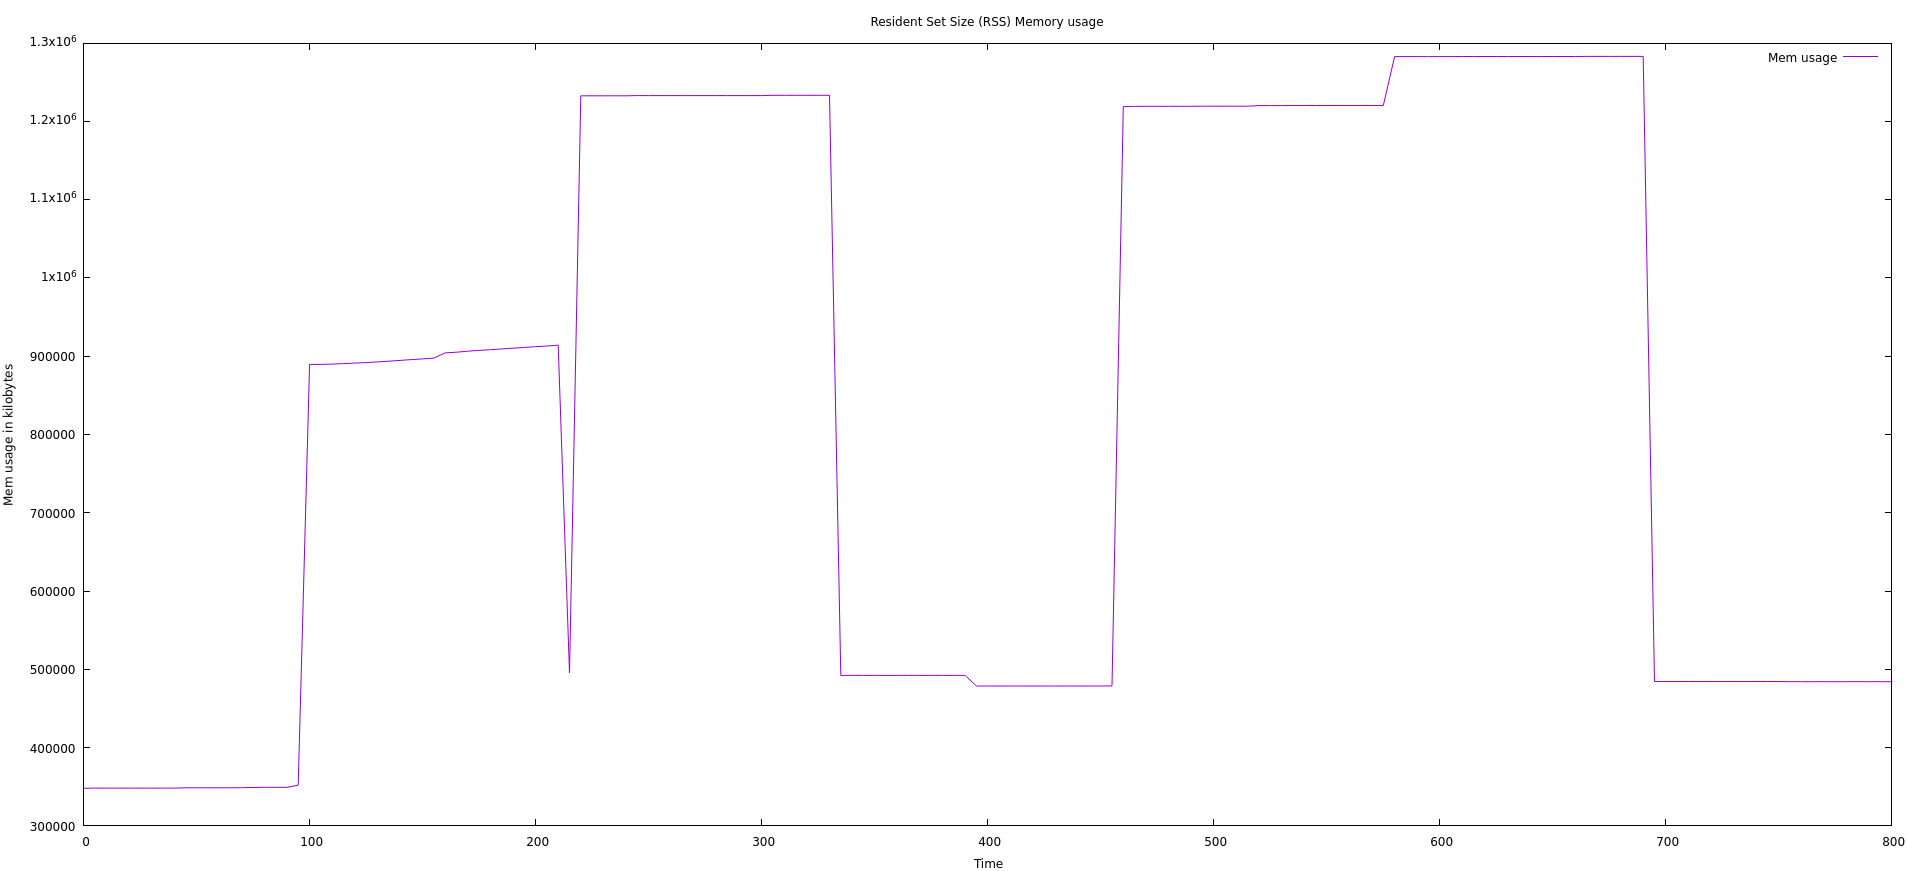
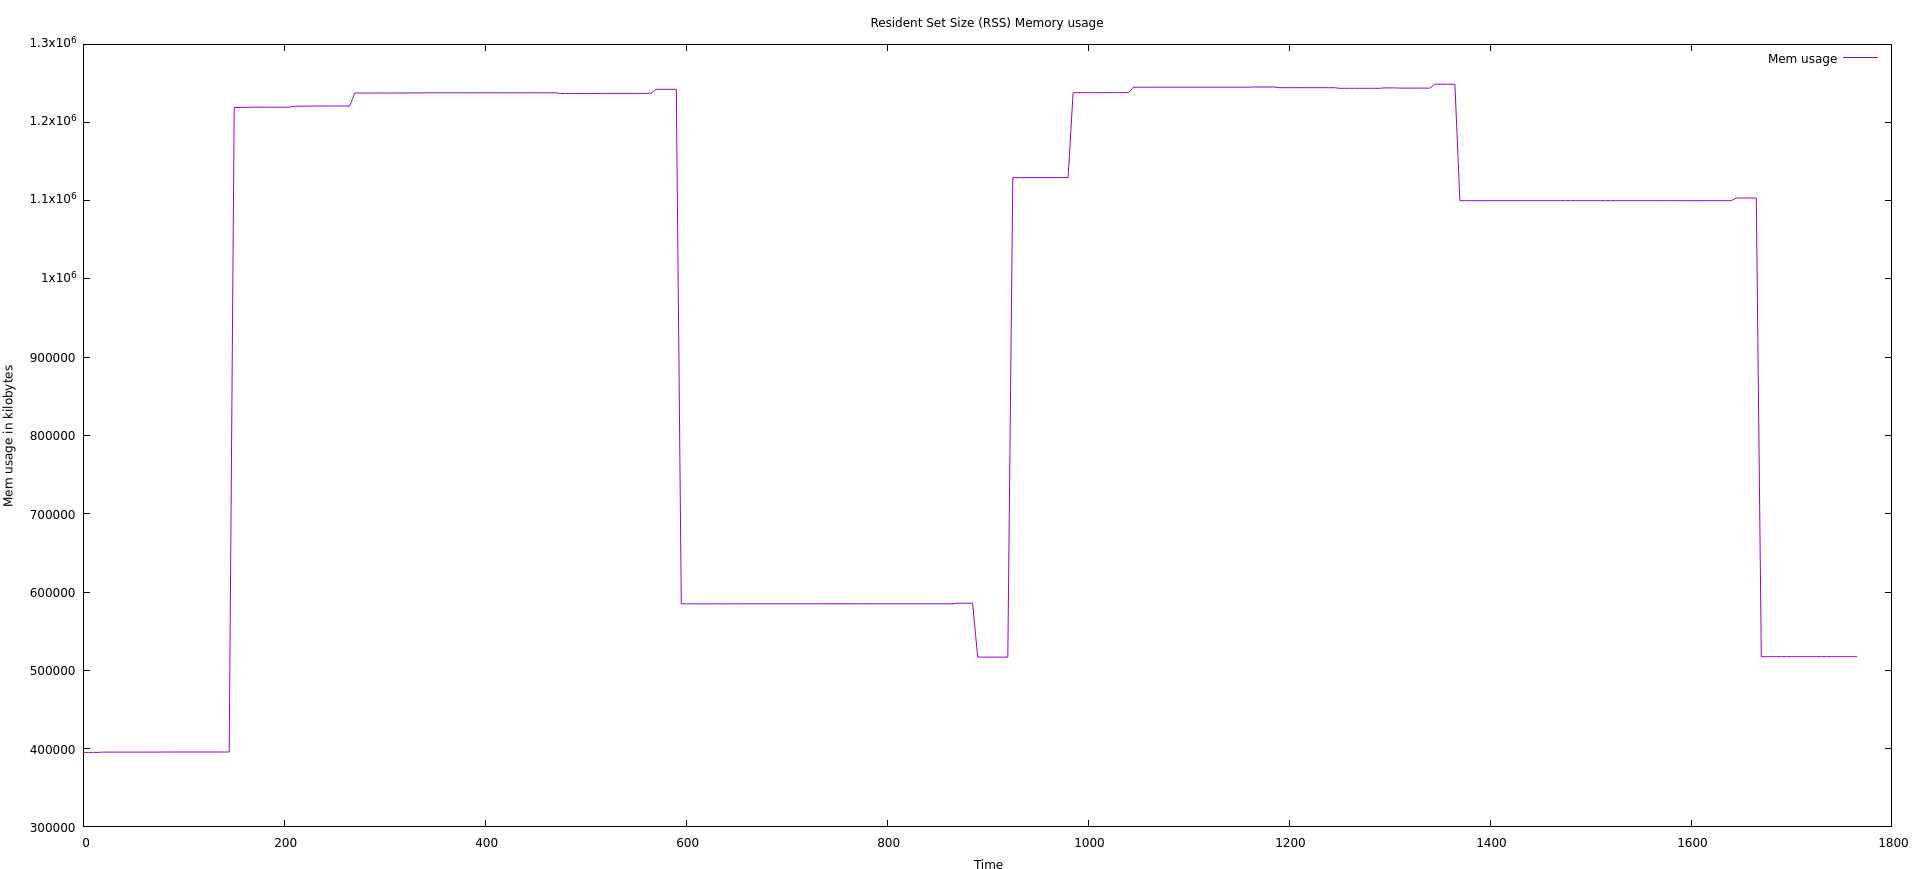
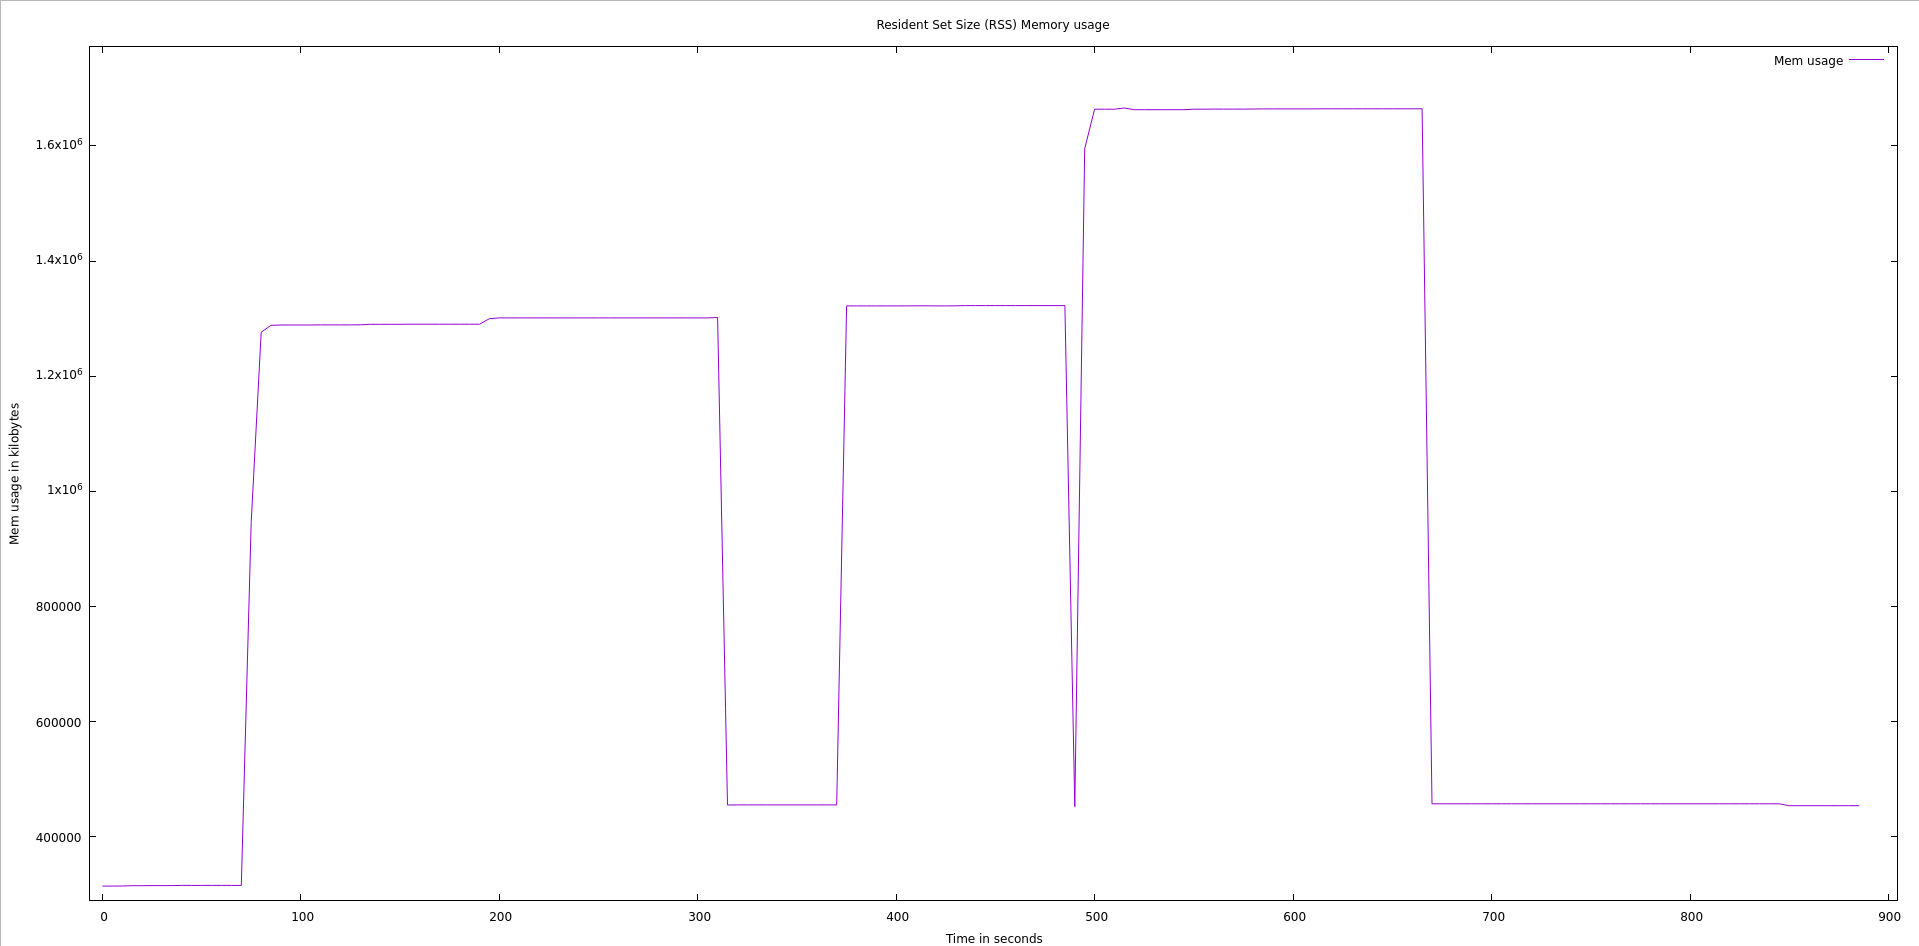
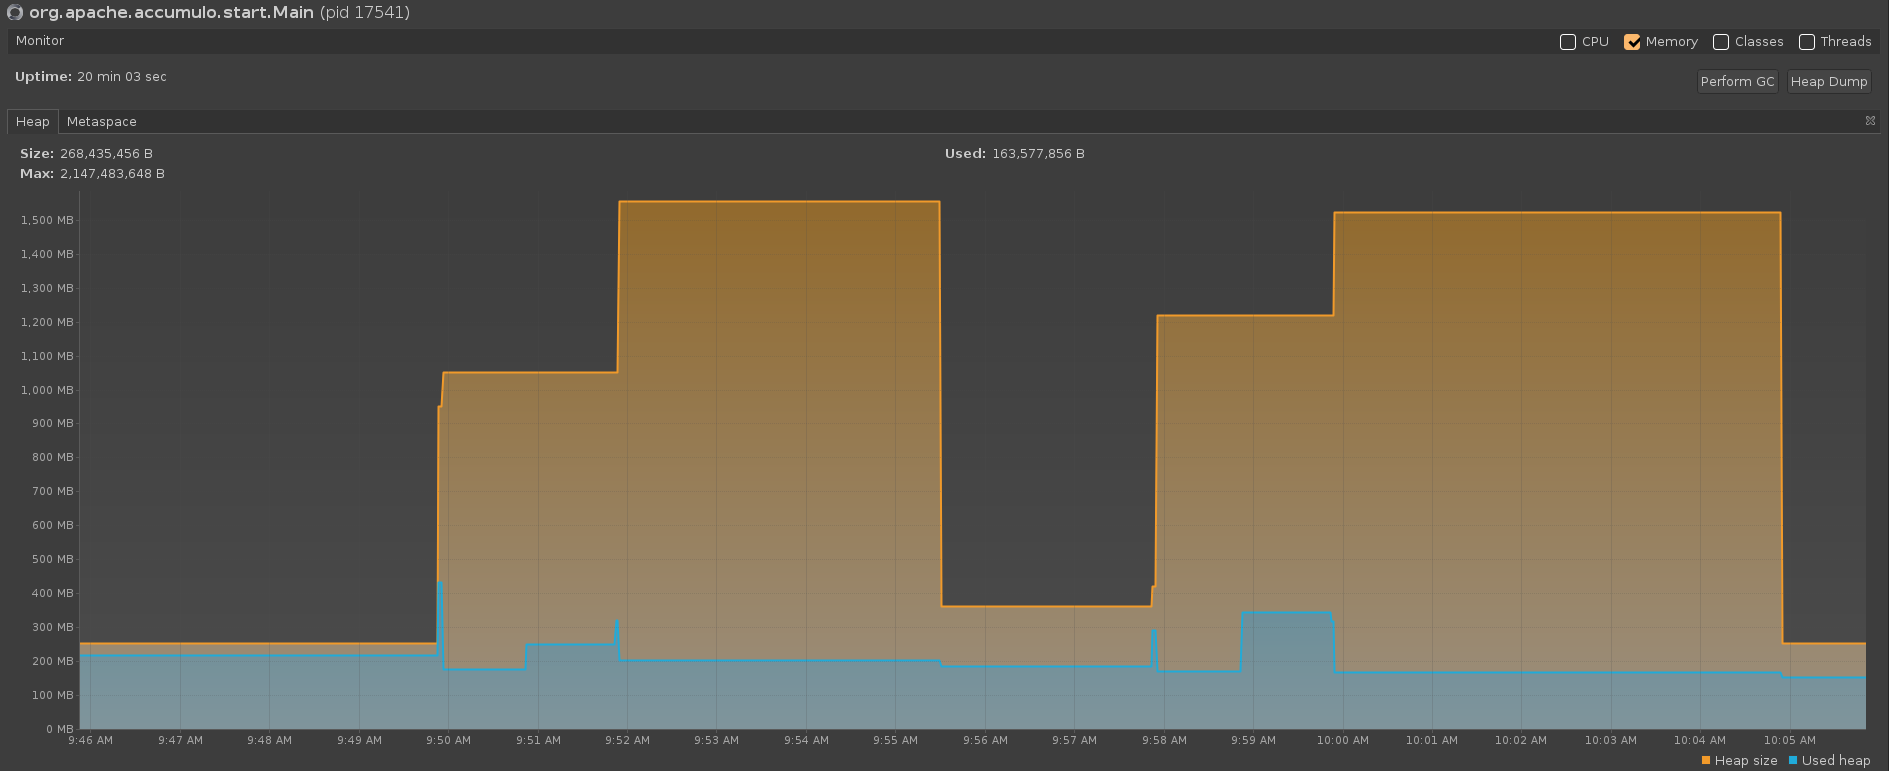
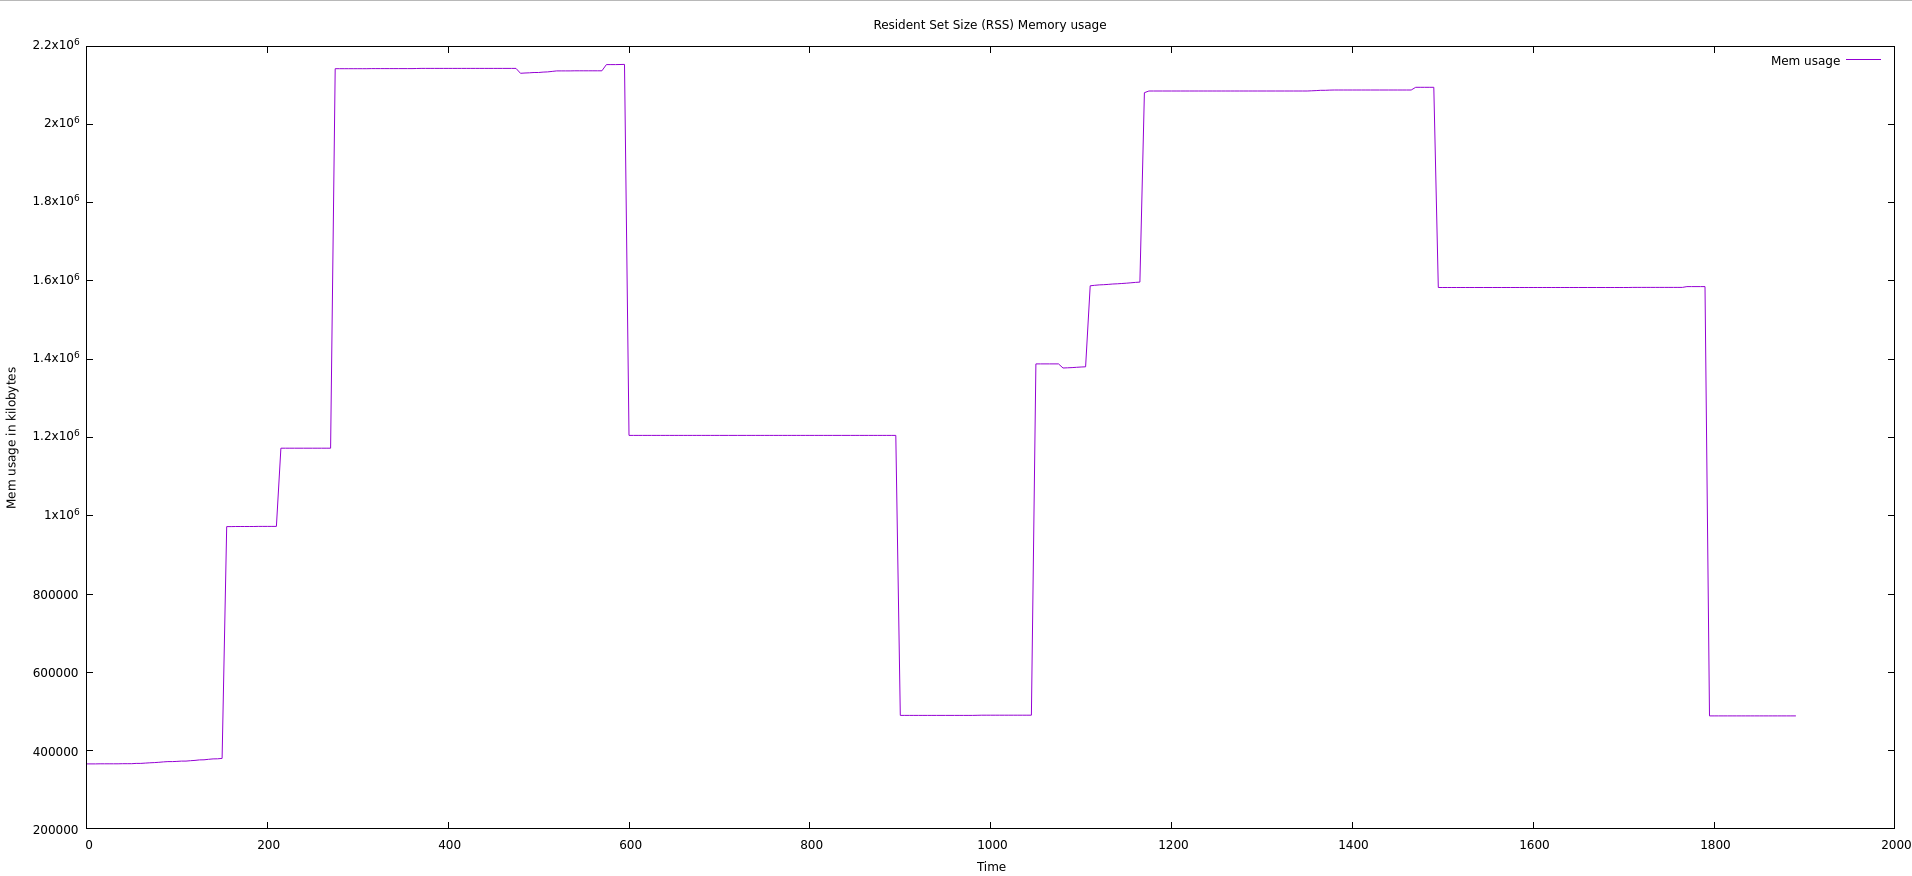
The amount that is never released back to the OS appears to be minimal and may only be present with G1 GC and Shenandoah GC. In the following graph with Java 17 using G1 GC, we see that the baseline OS memory usage before any compactions are done is a bit less than 400MB. We see that after a compaction is done and the garbage collection runs, this baseline settles at about 500MB.
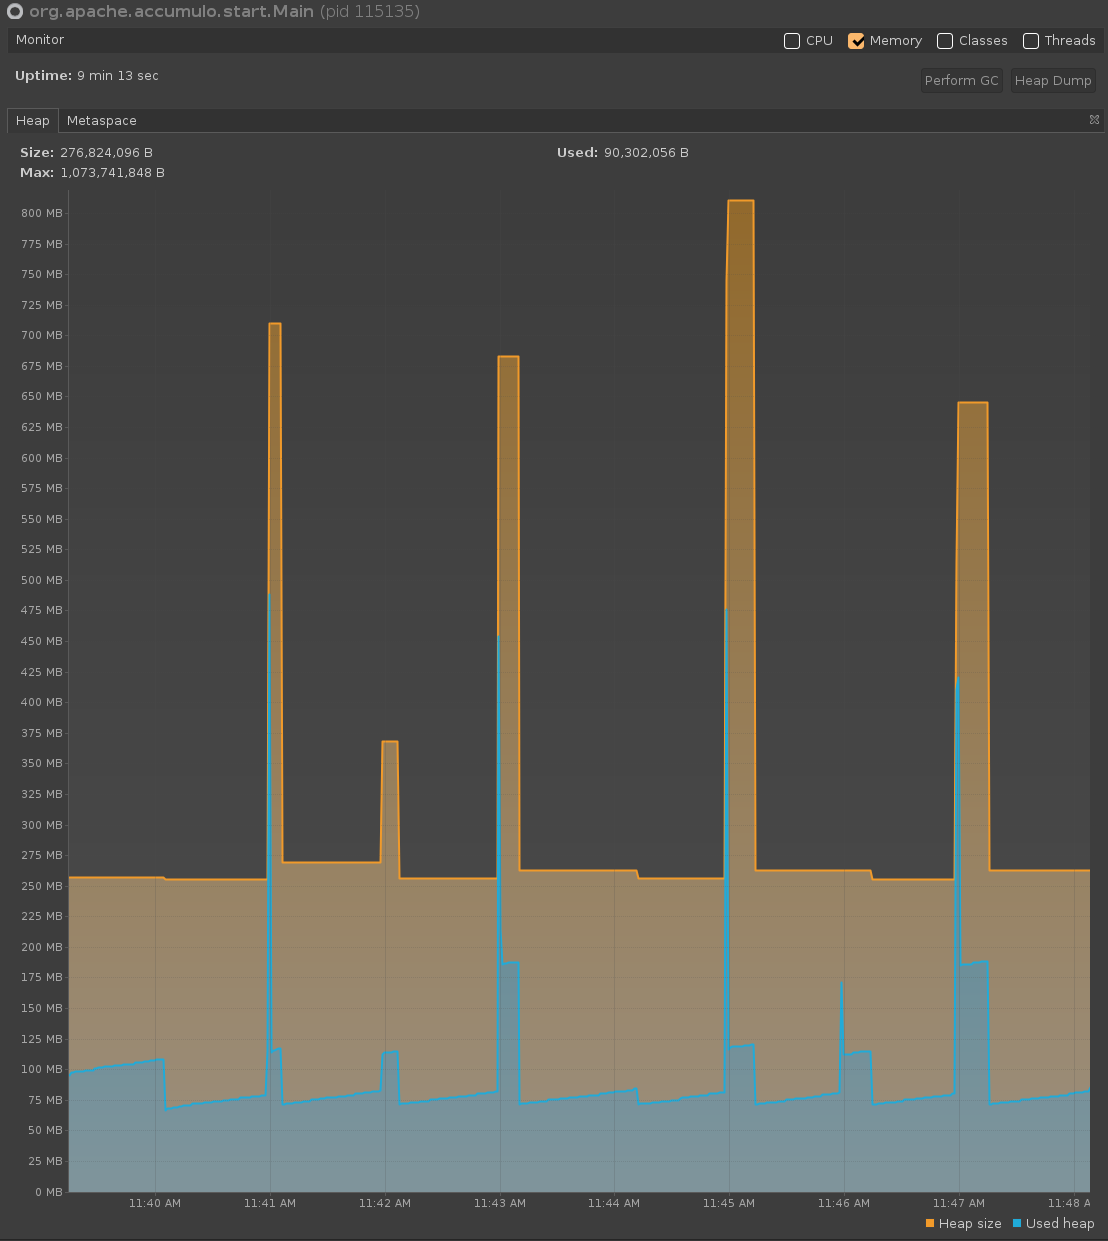
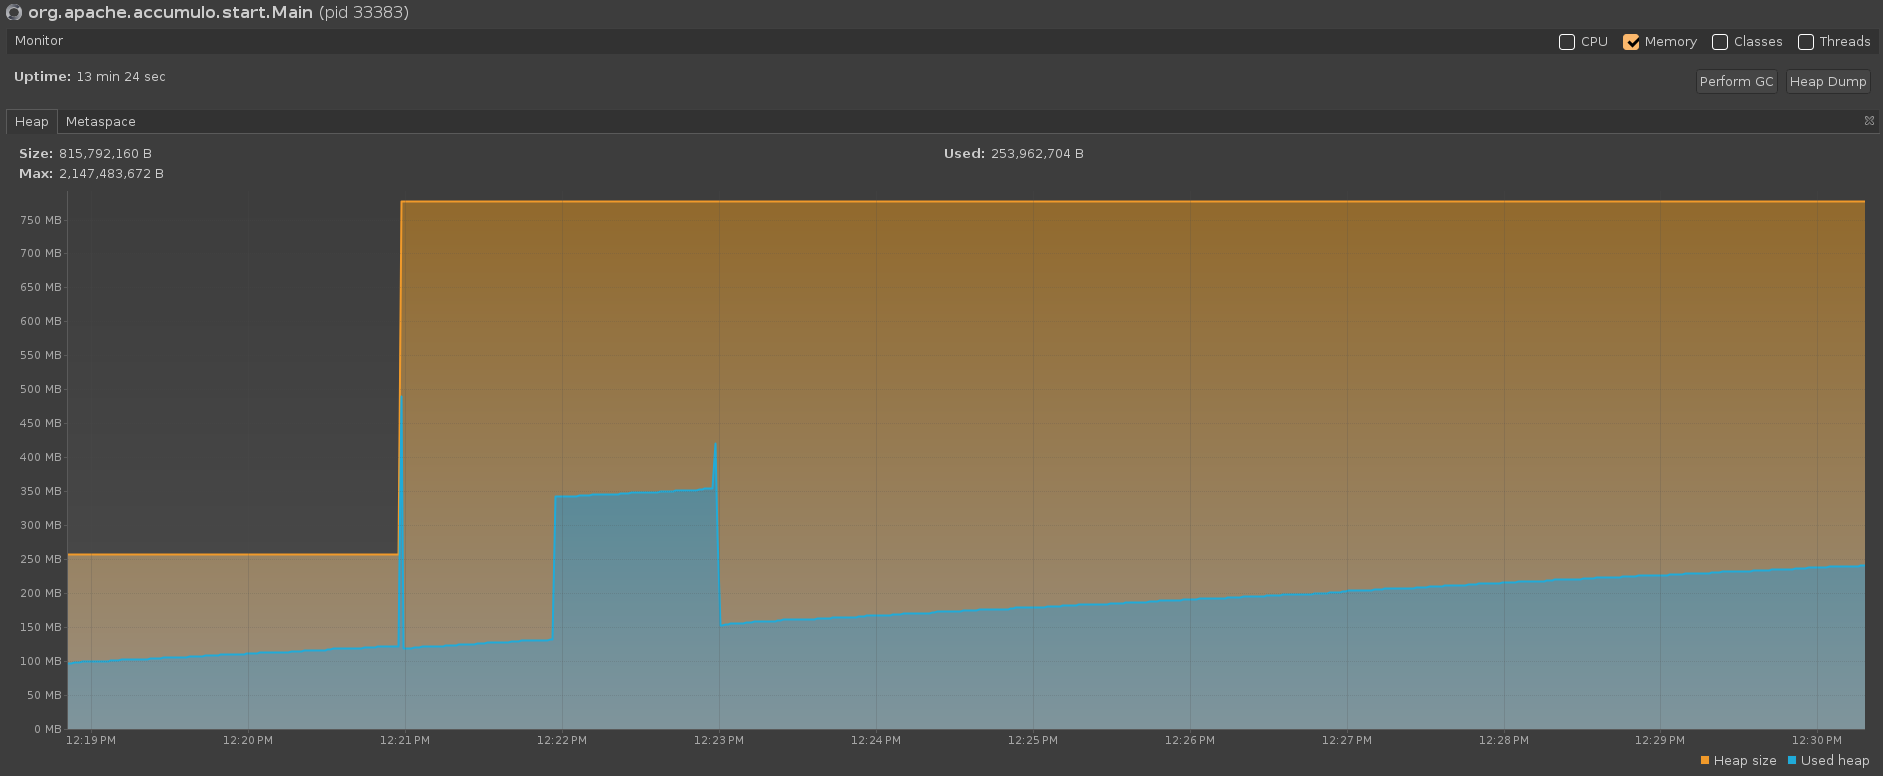
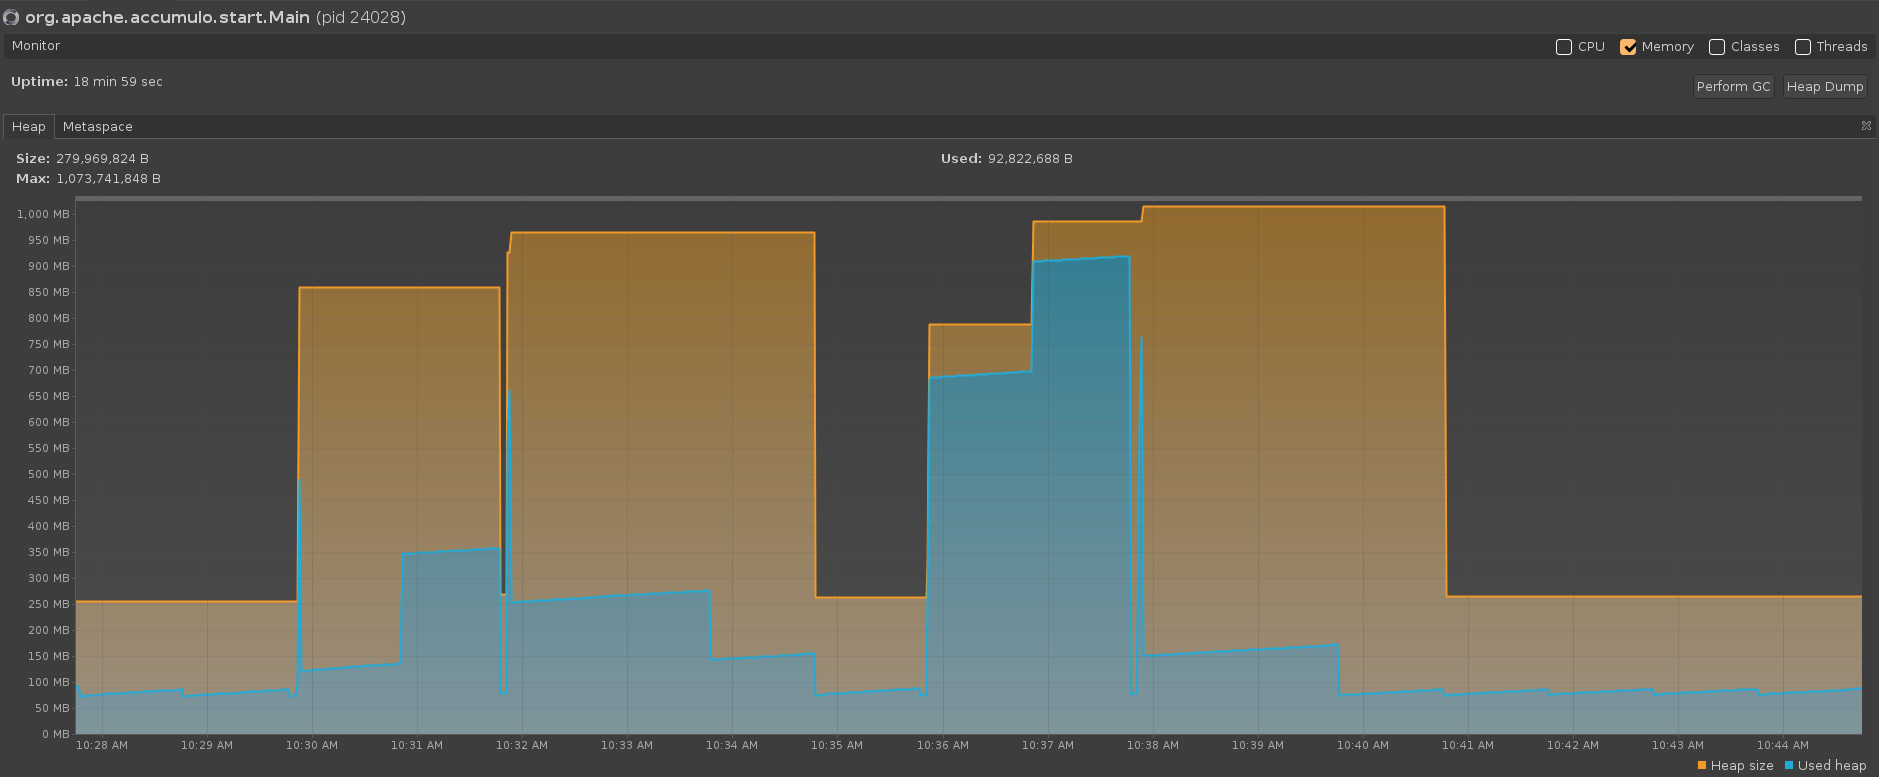
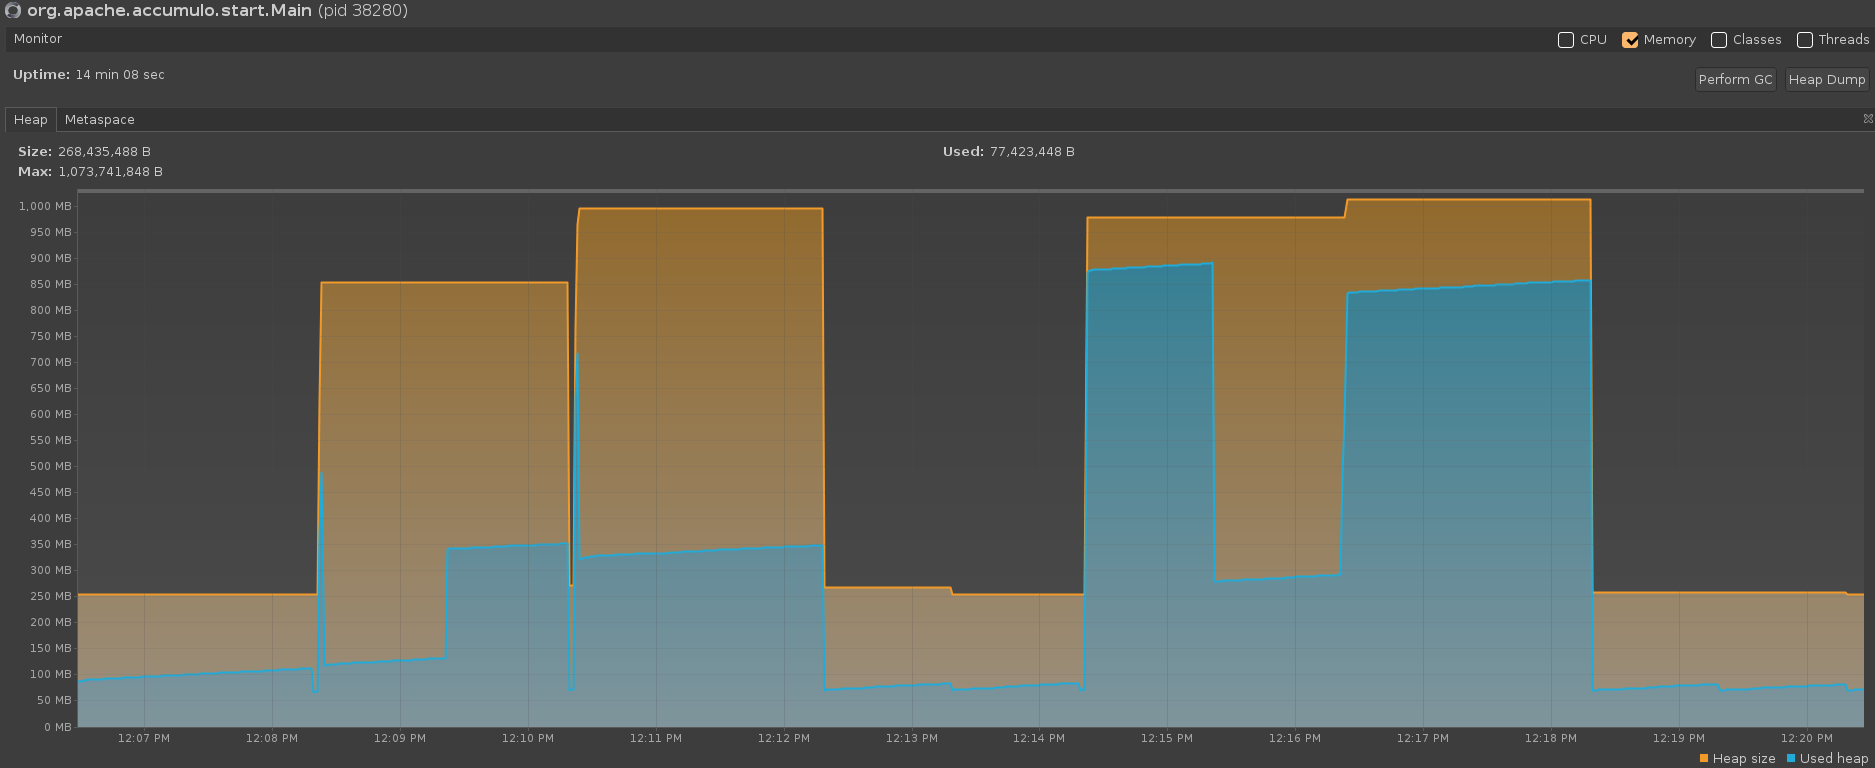
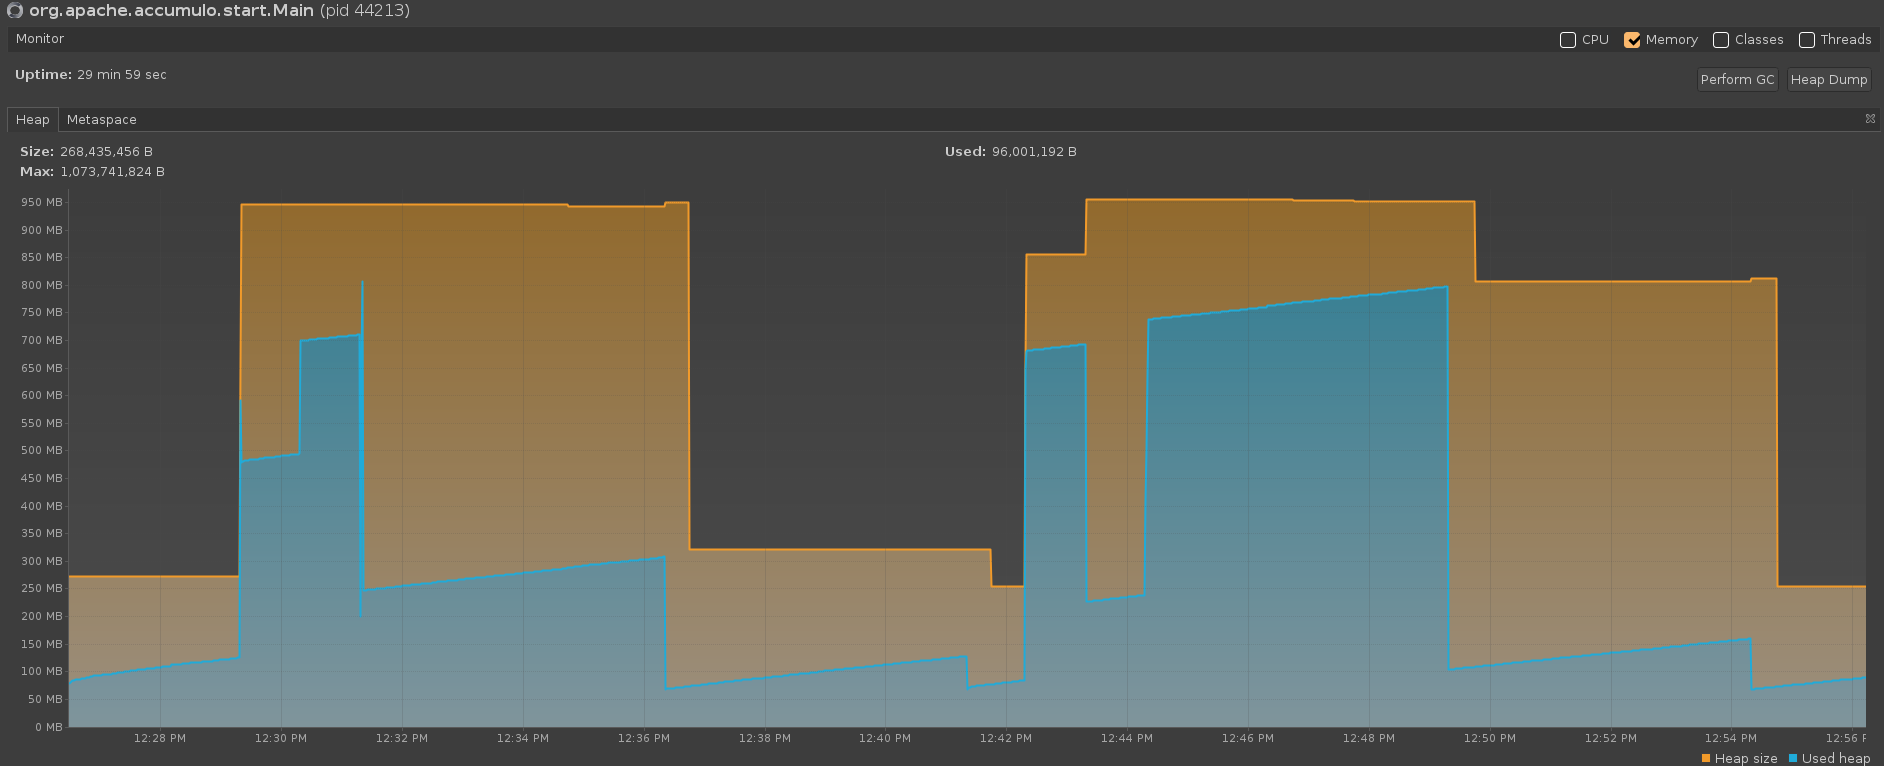
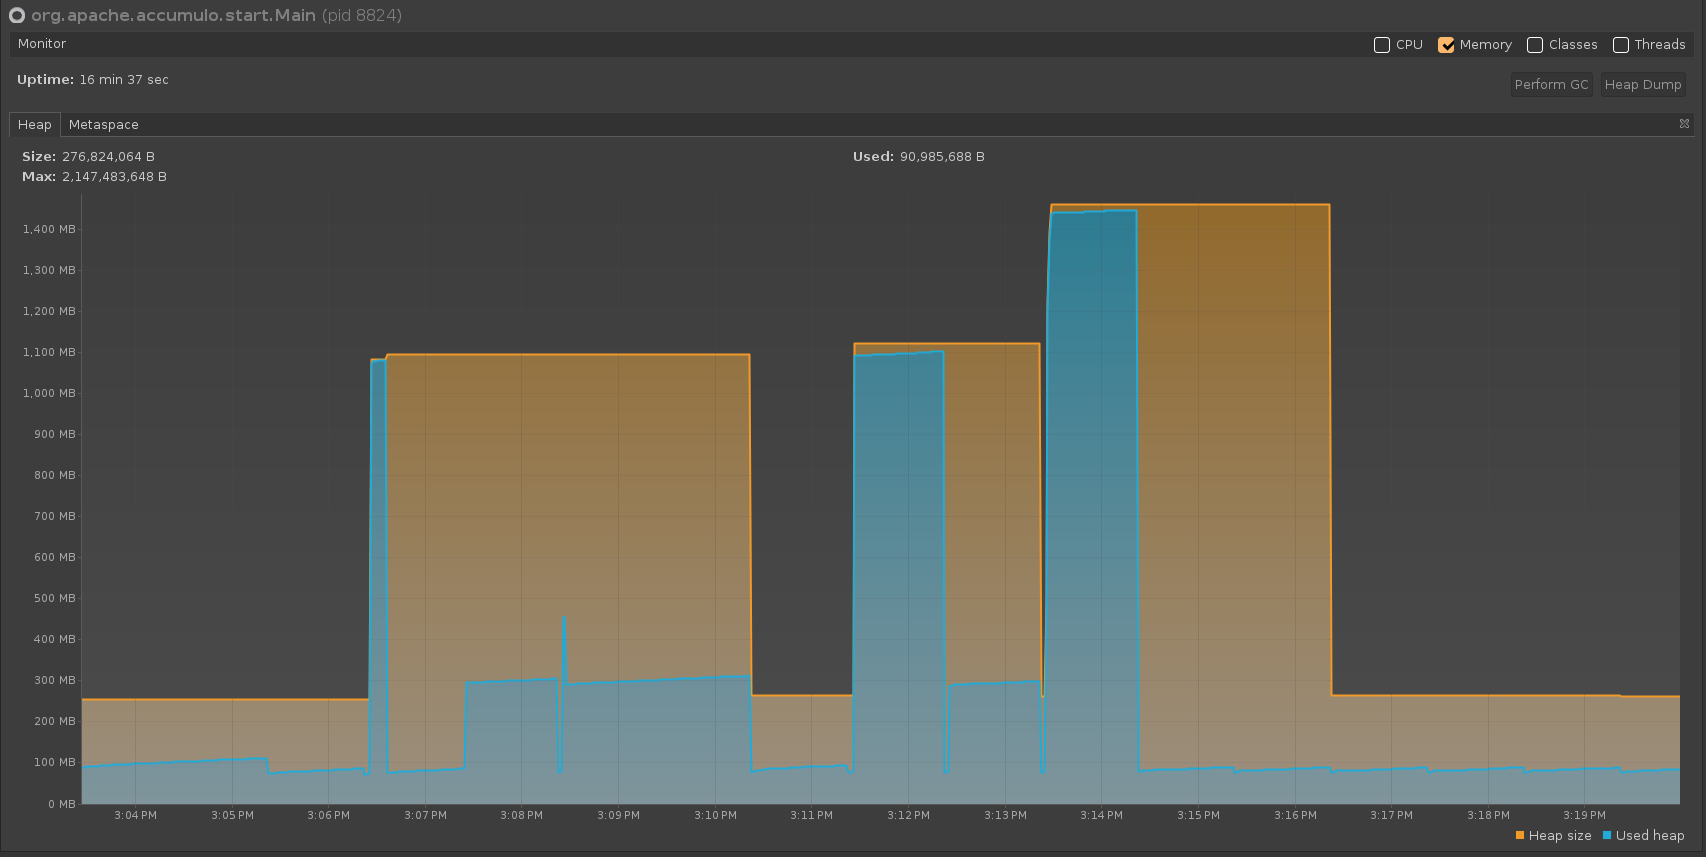
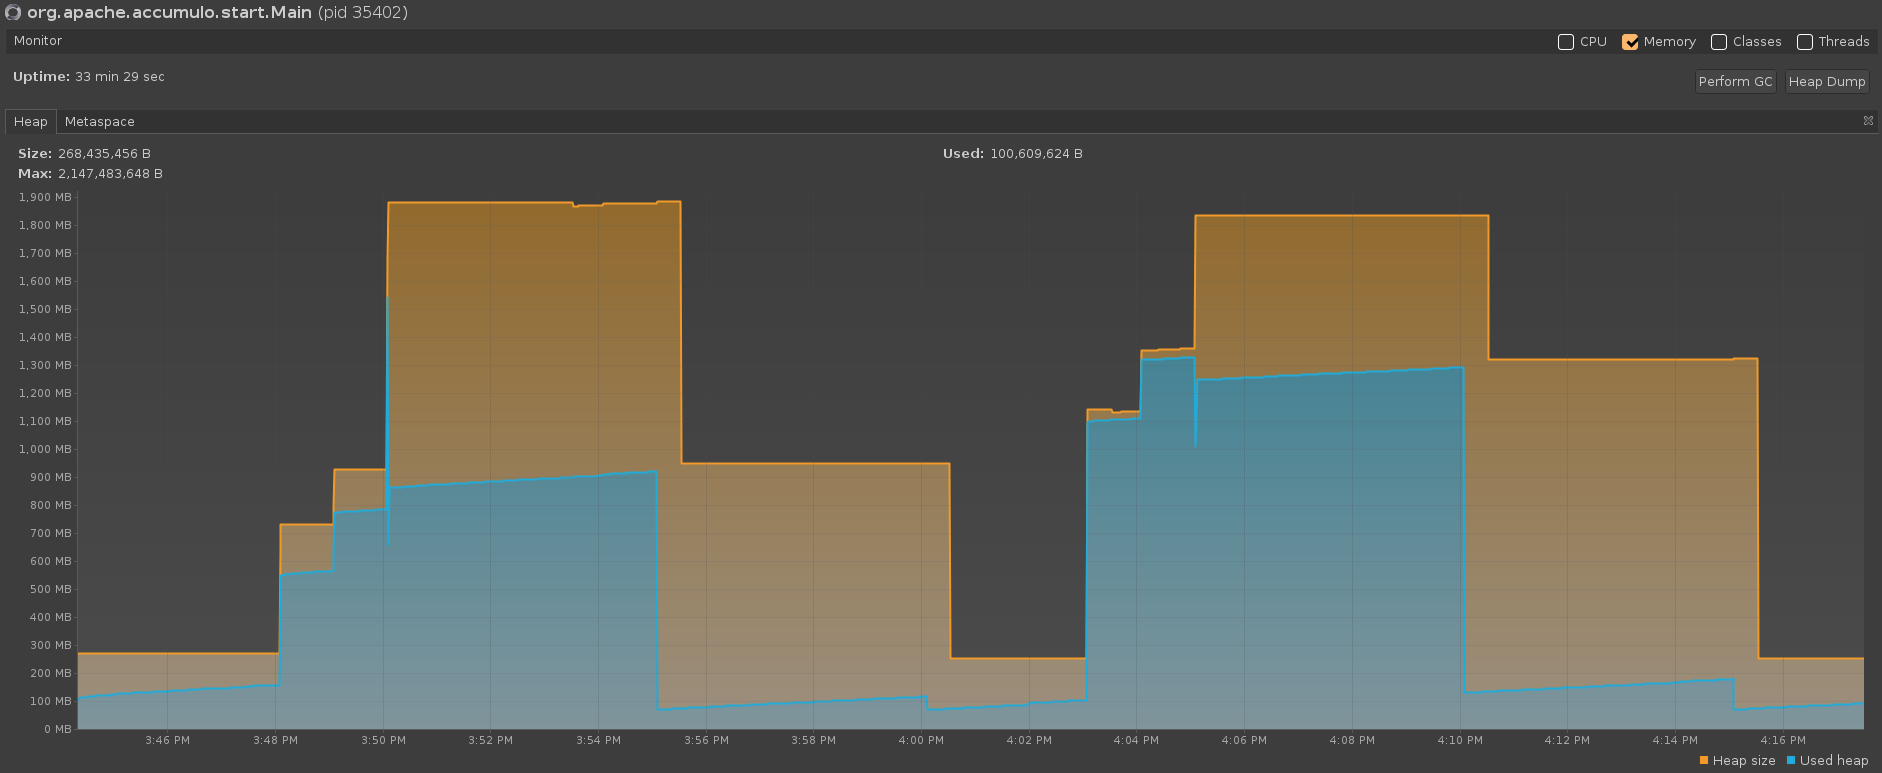
On the same test run, the JVM perspective (pictured in the graph below) shows that all memory is returned (memory usage drops back down to Xms=256m after garbage collection occurs).
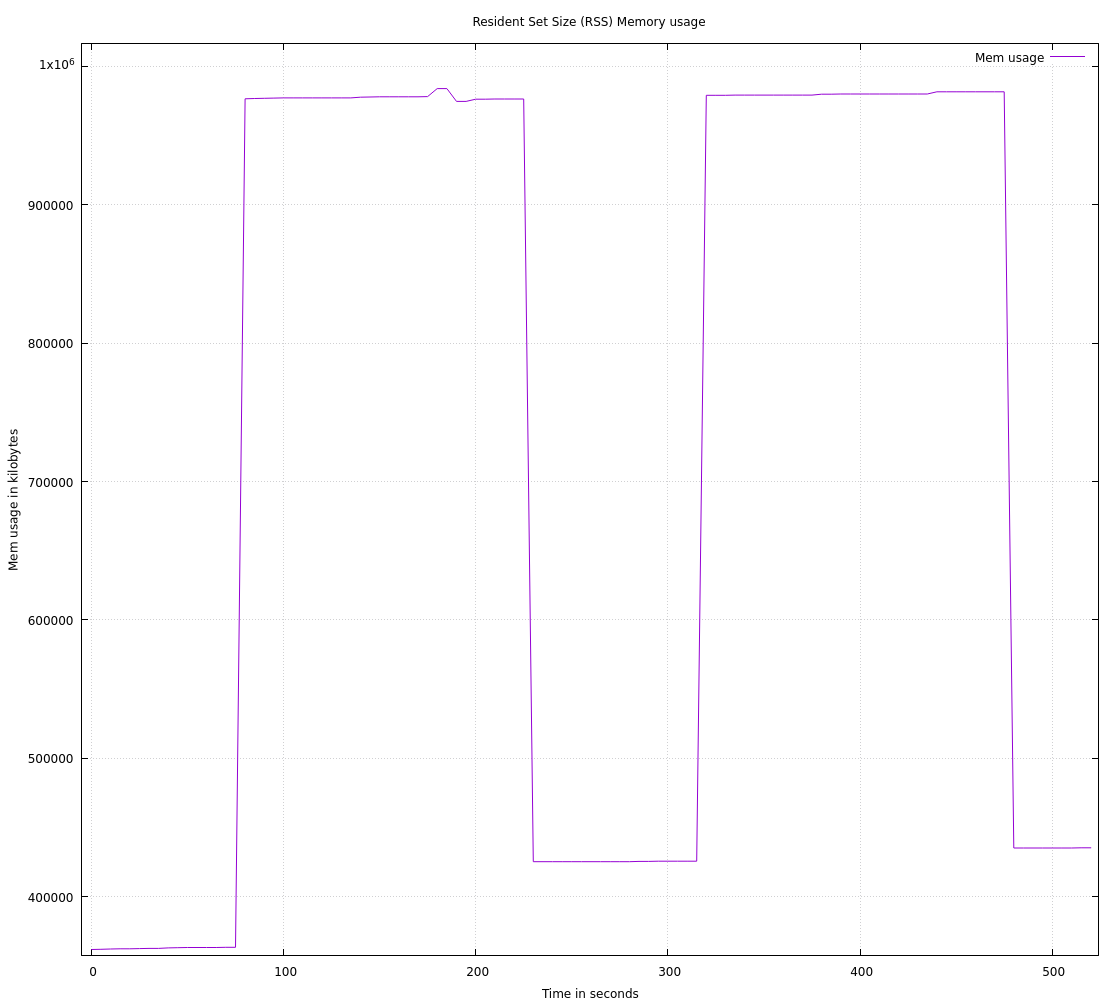
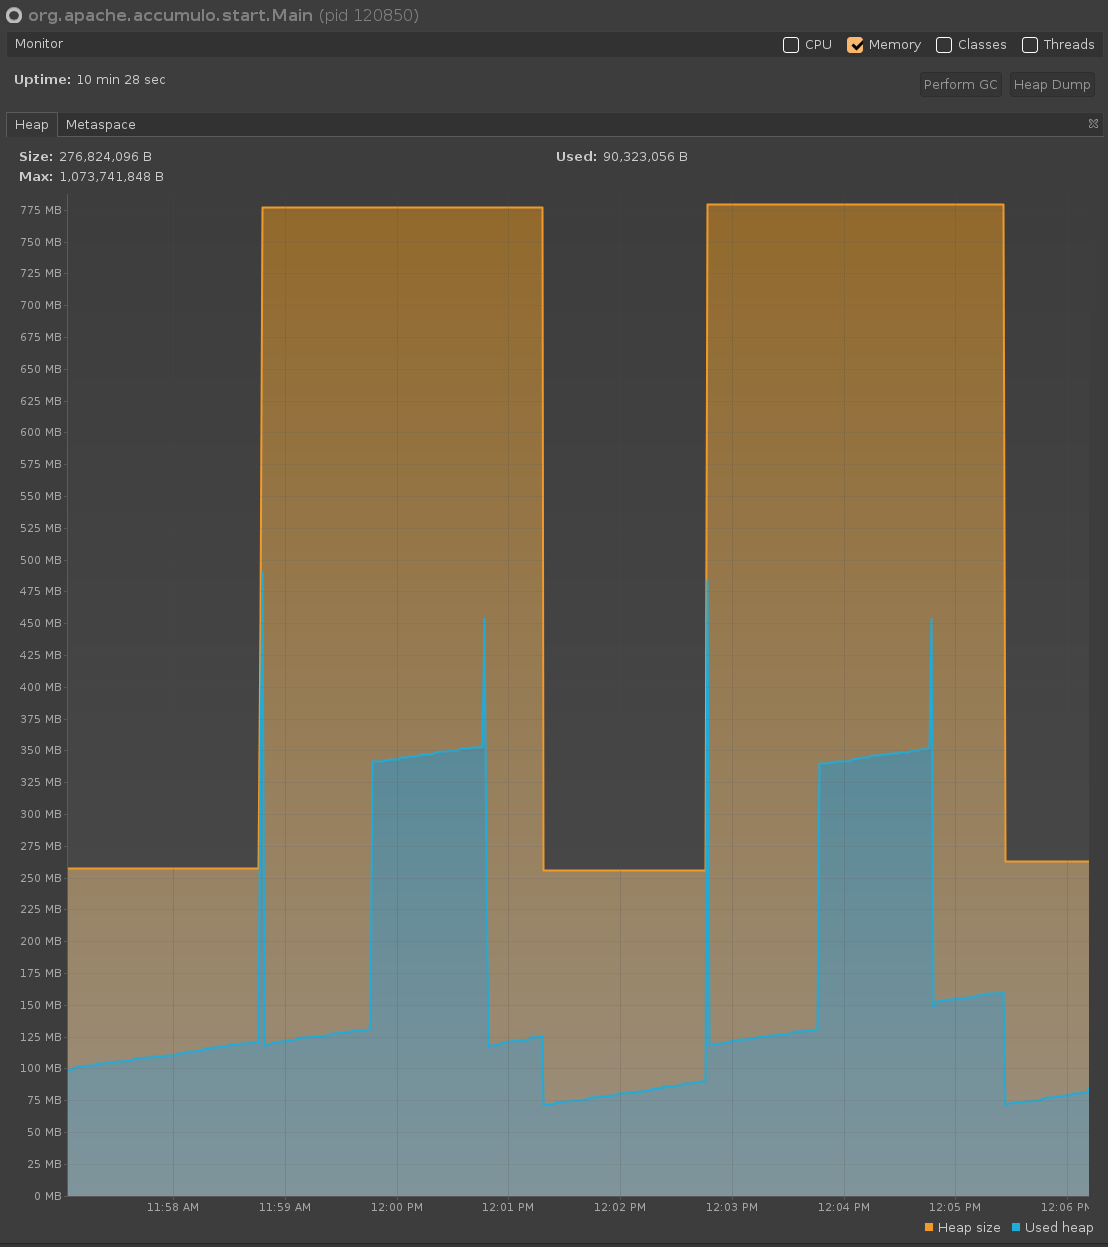
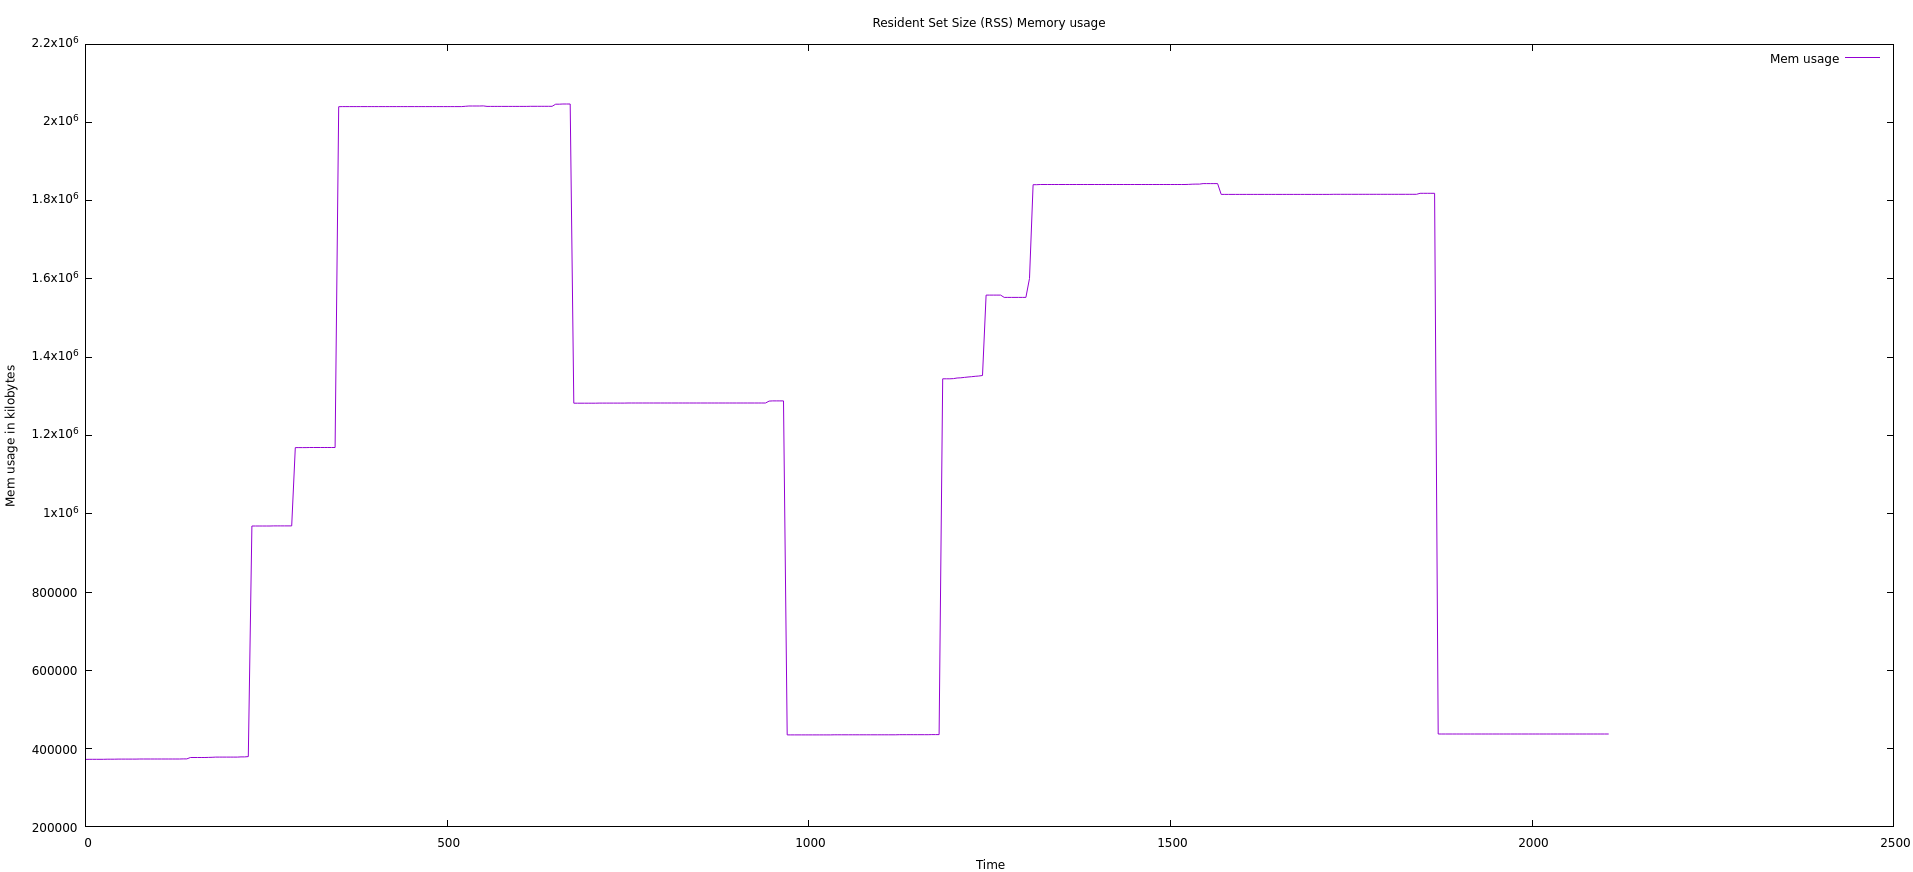
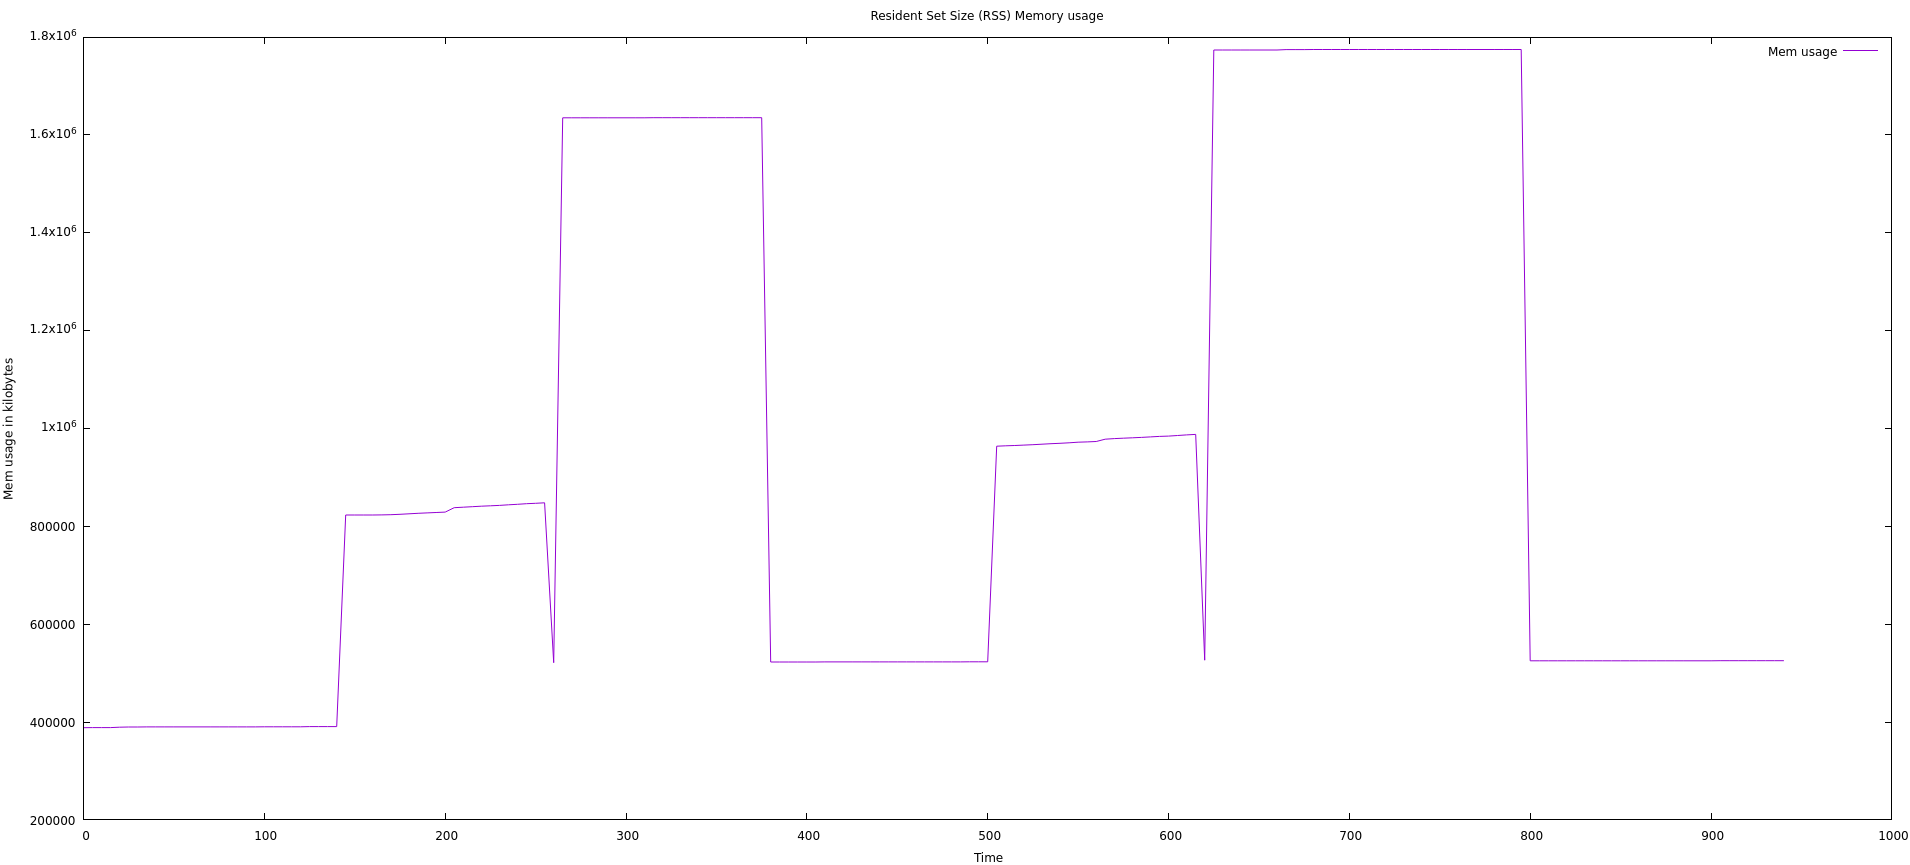
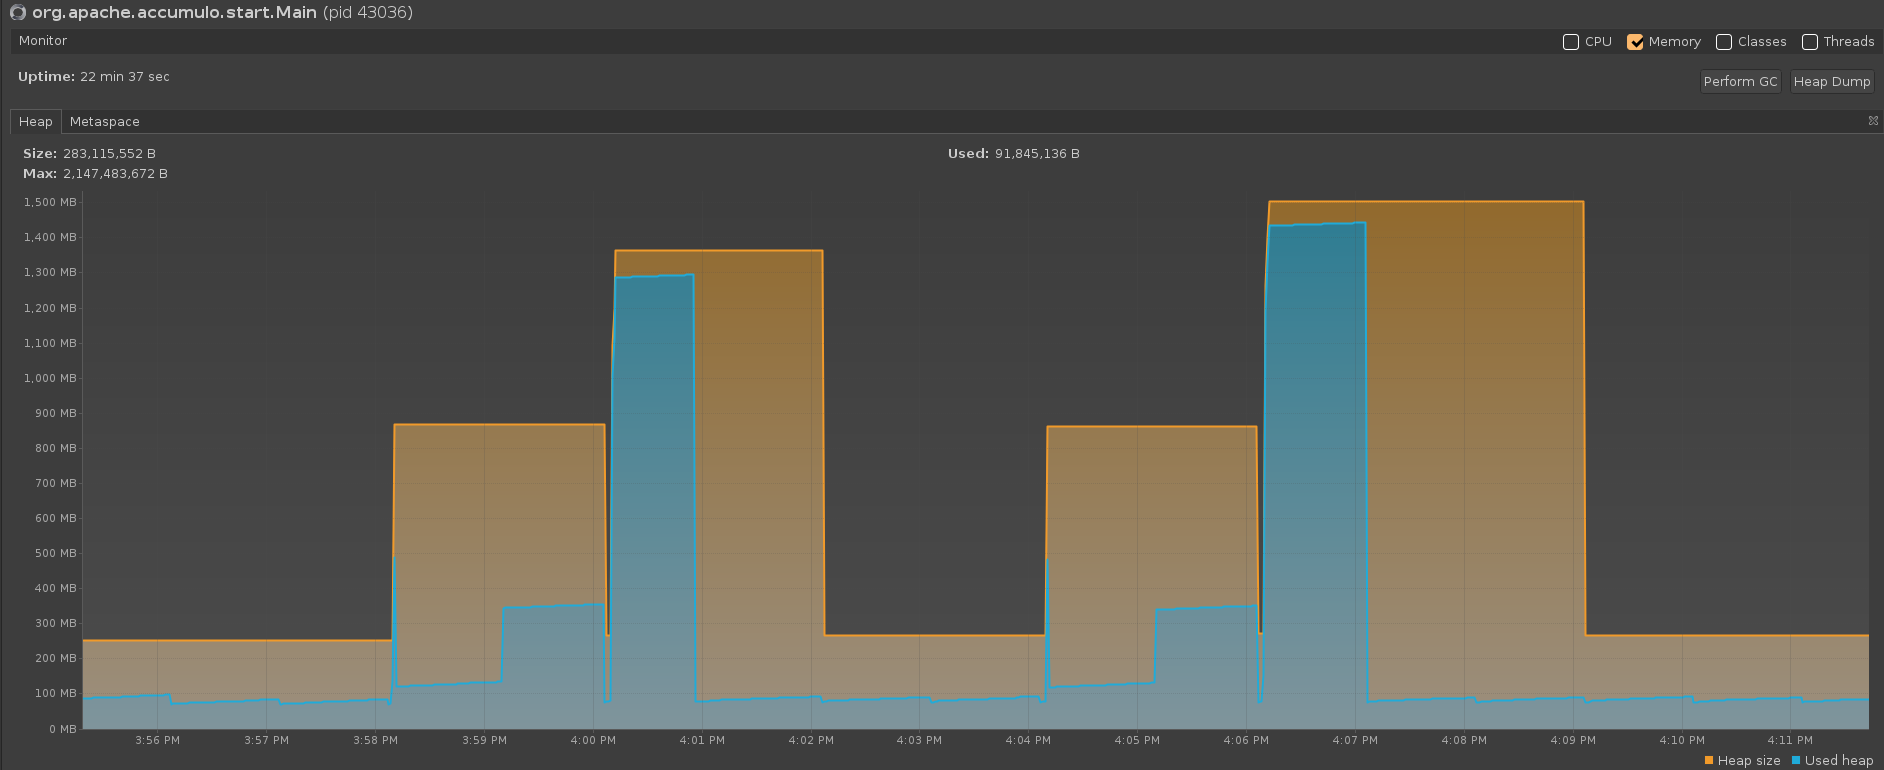
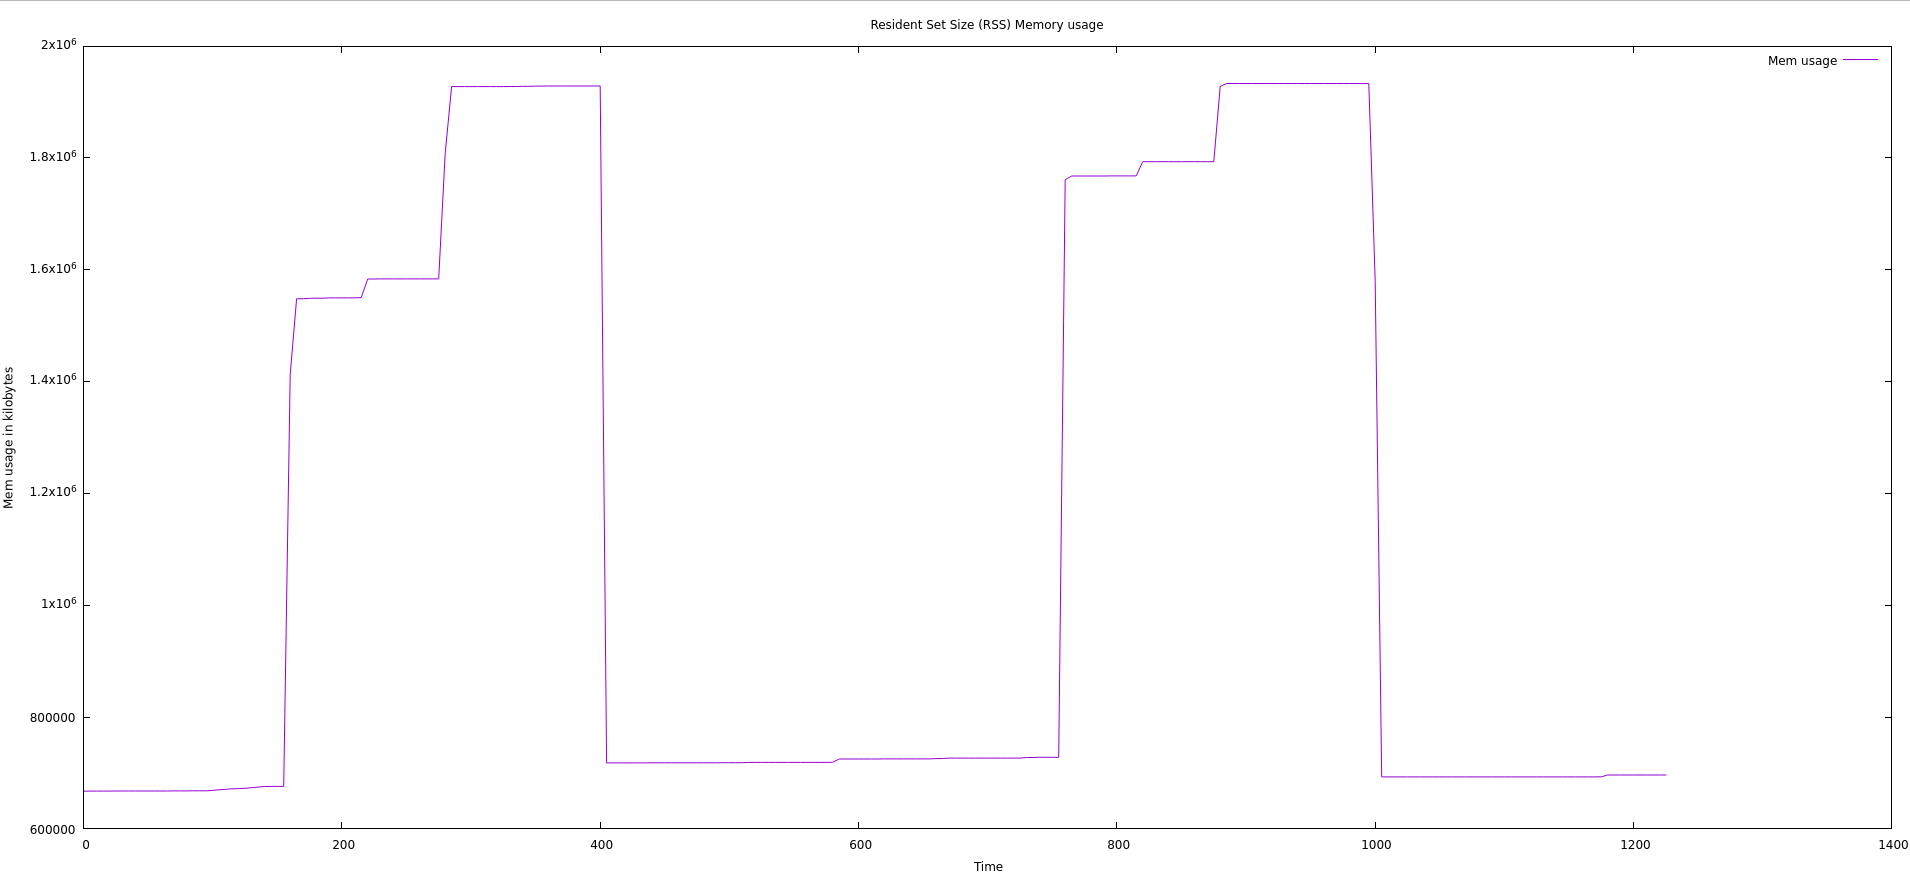
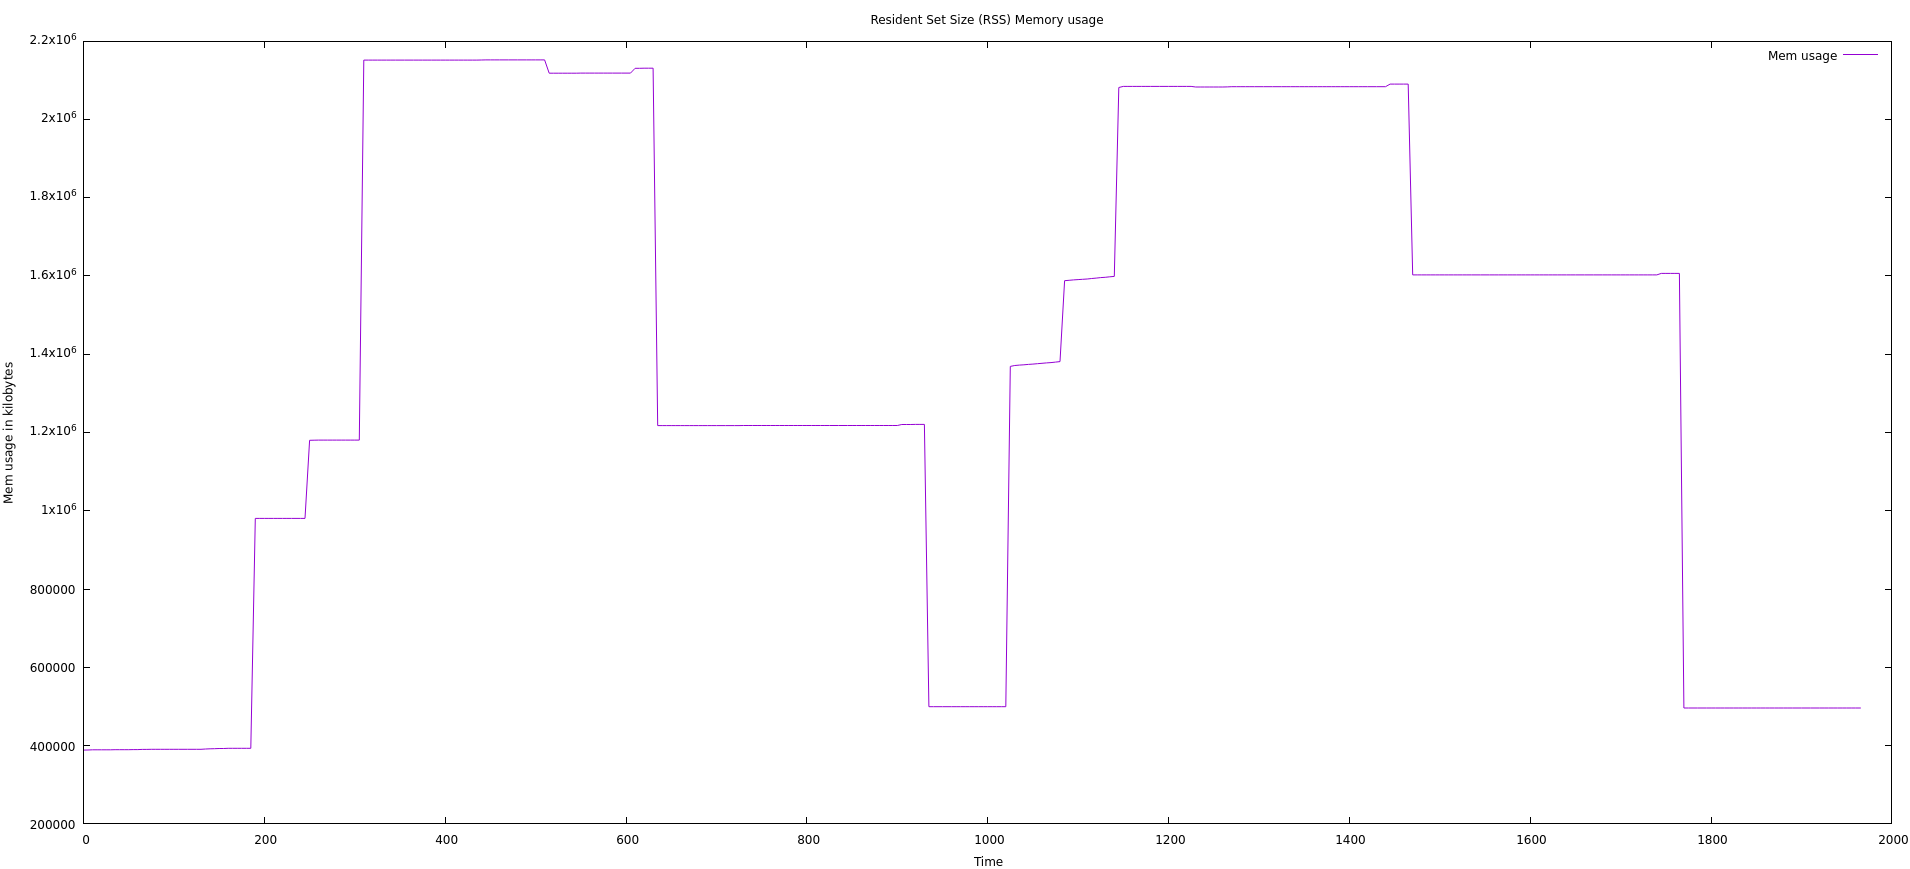
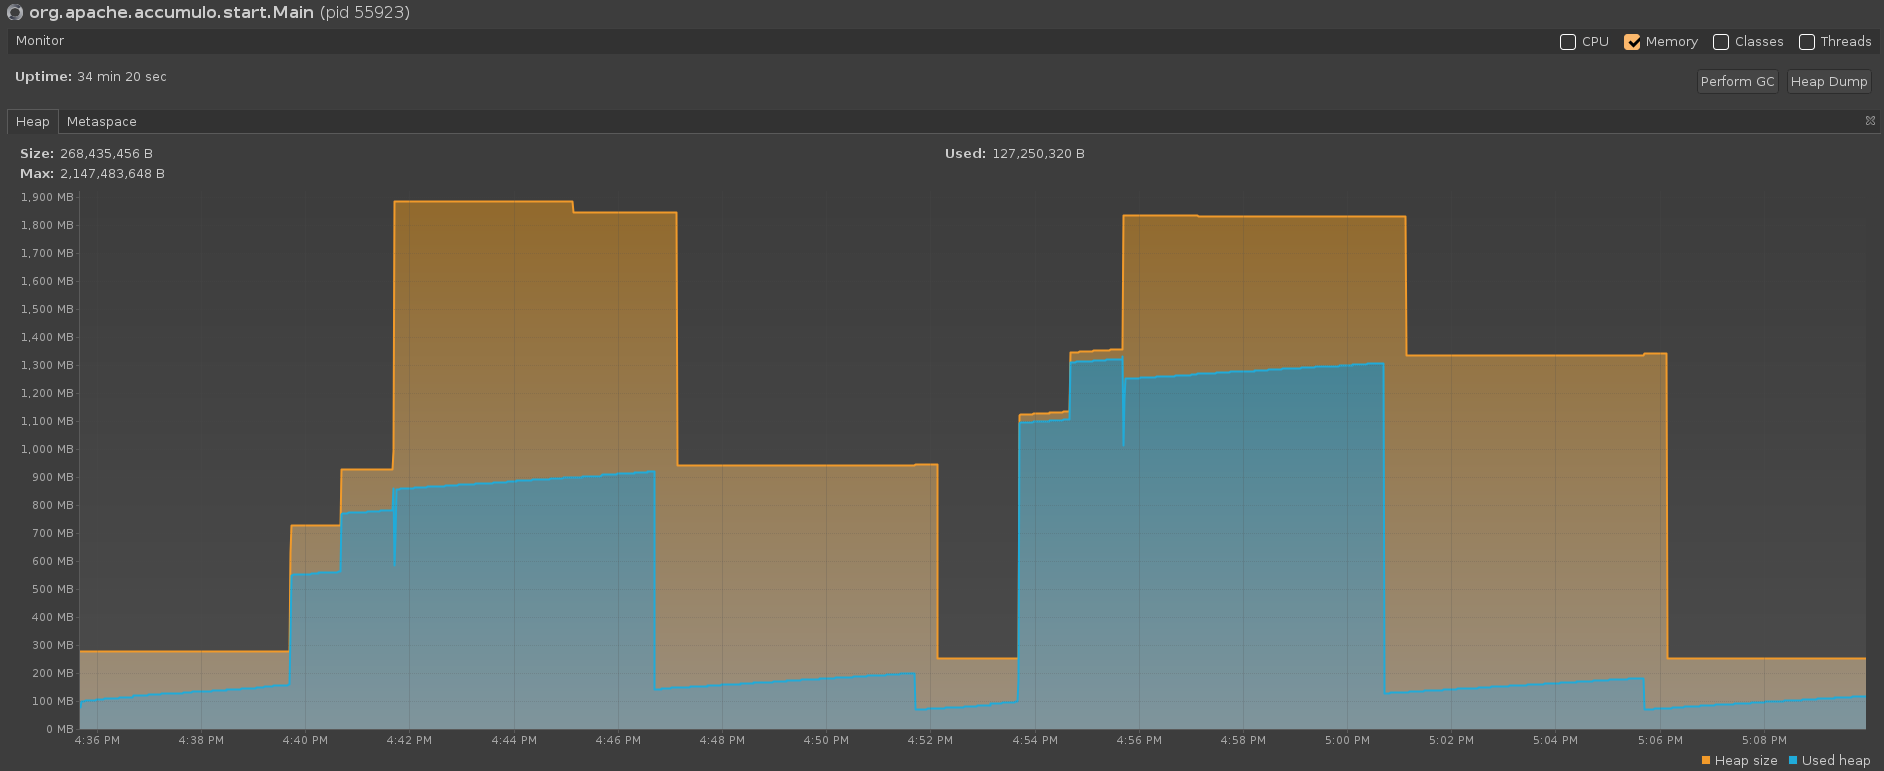
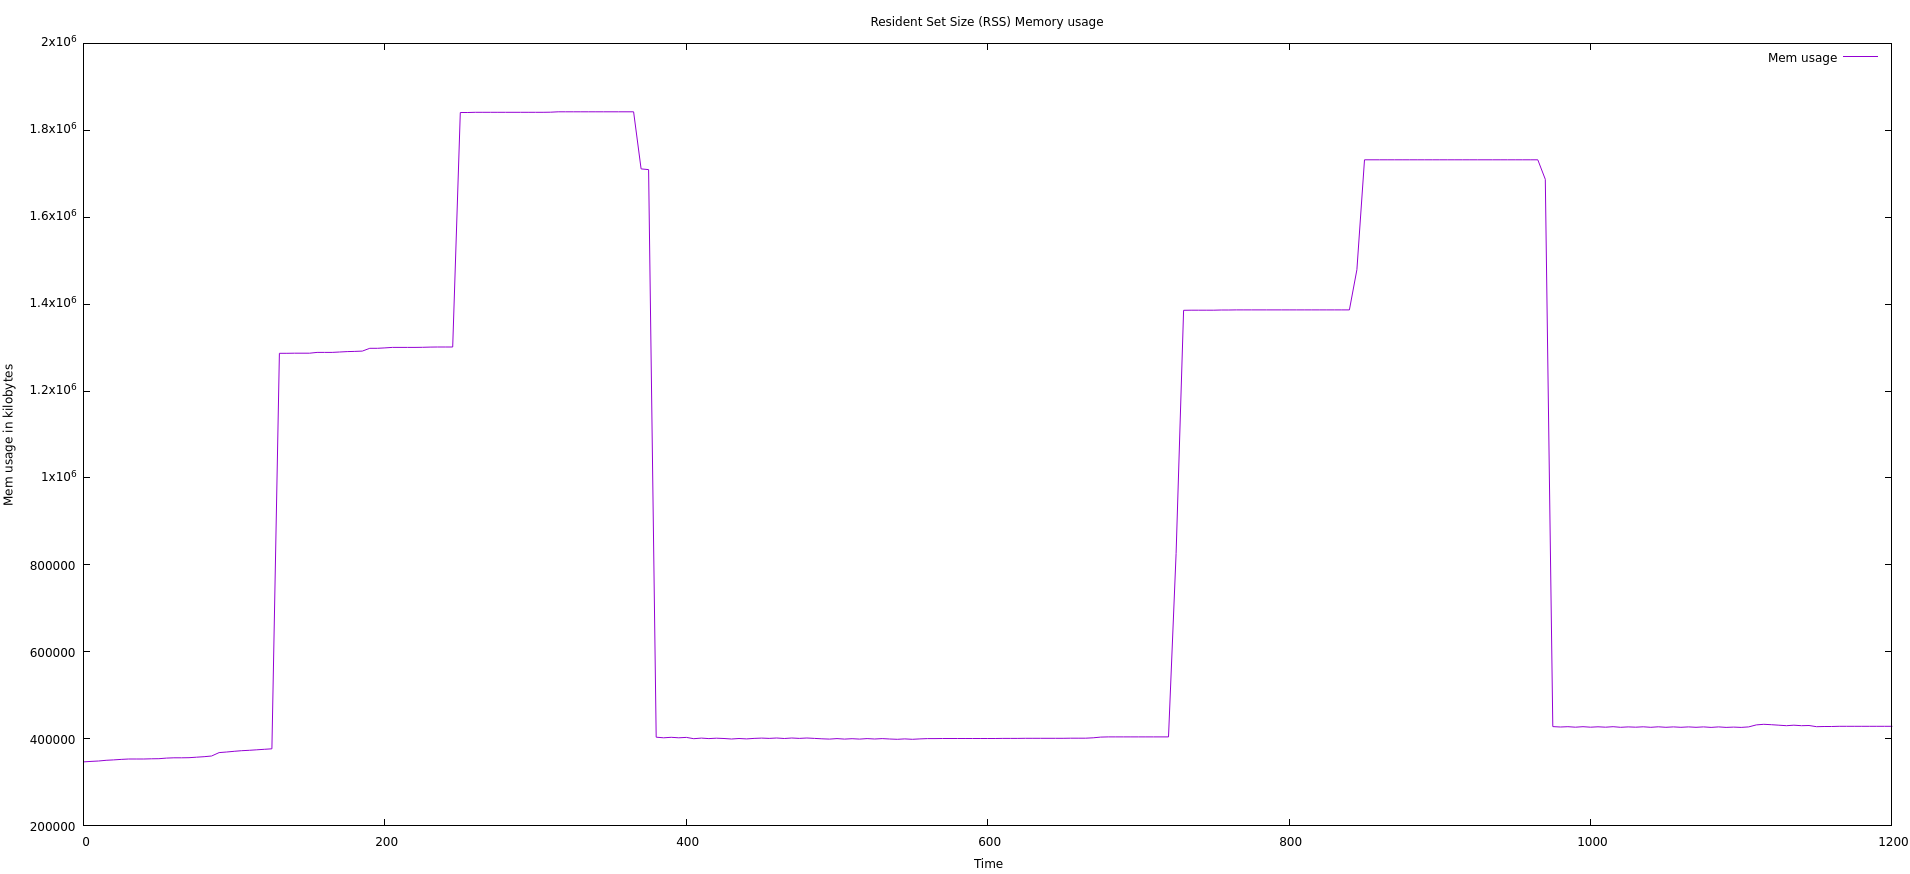
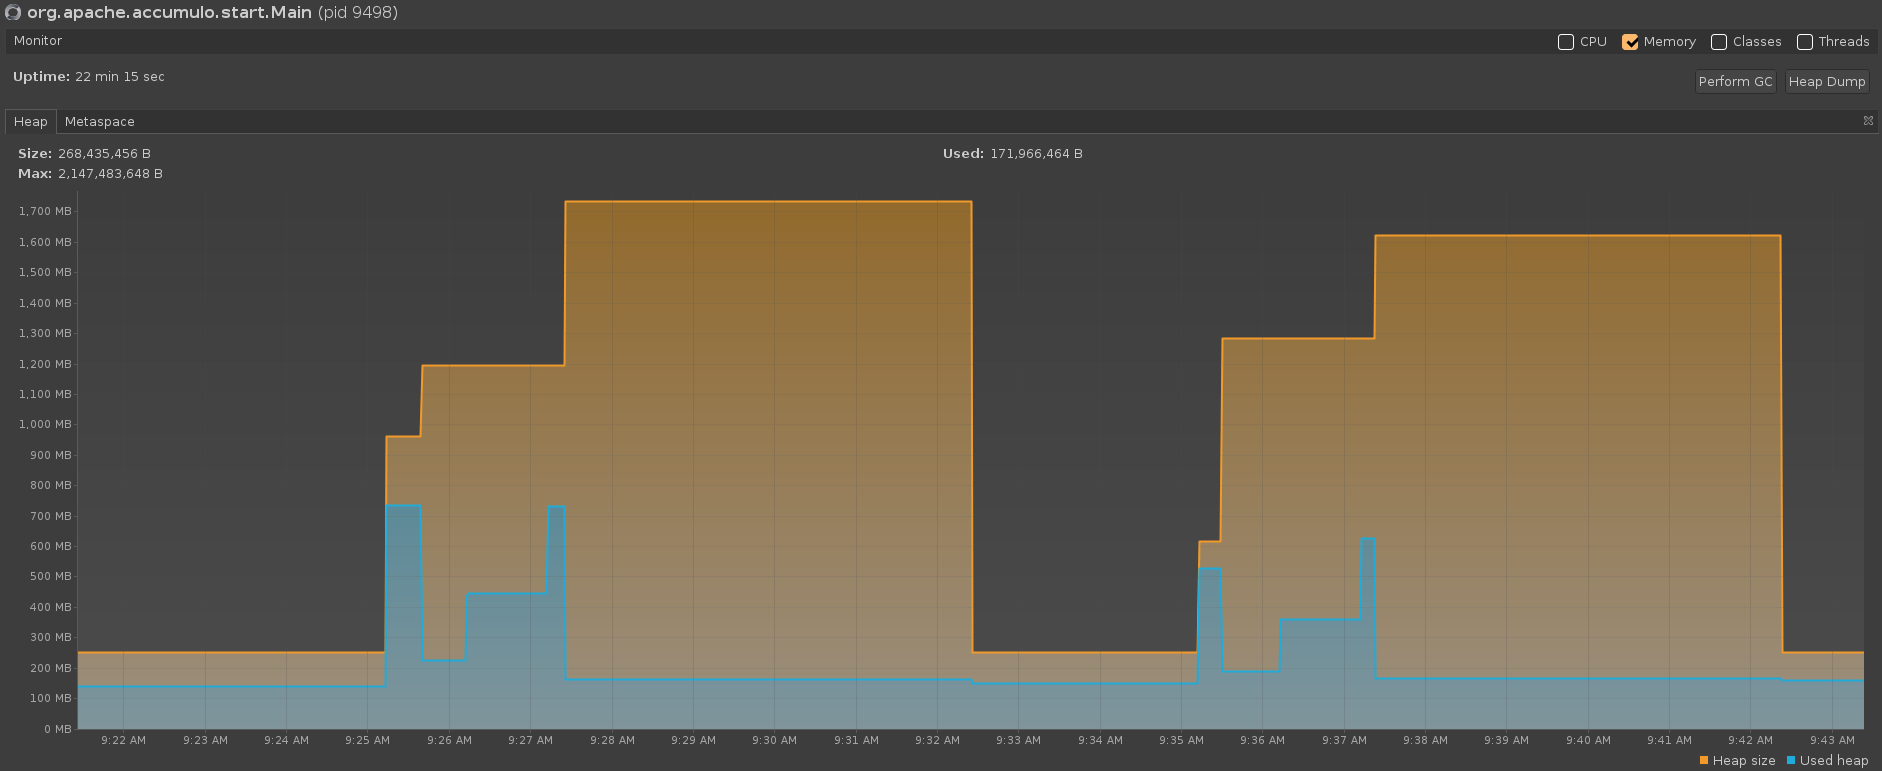
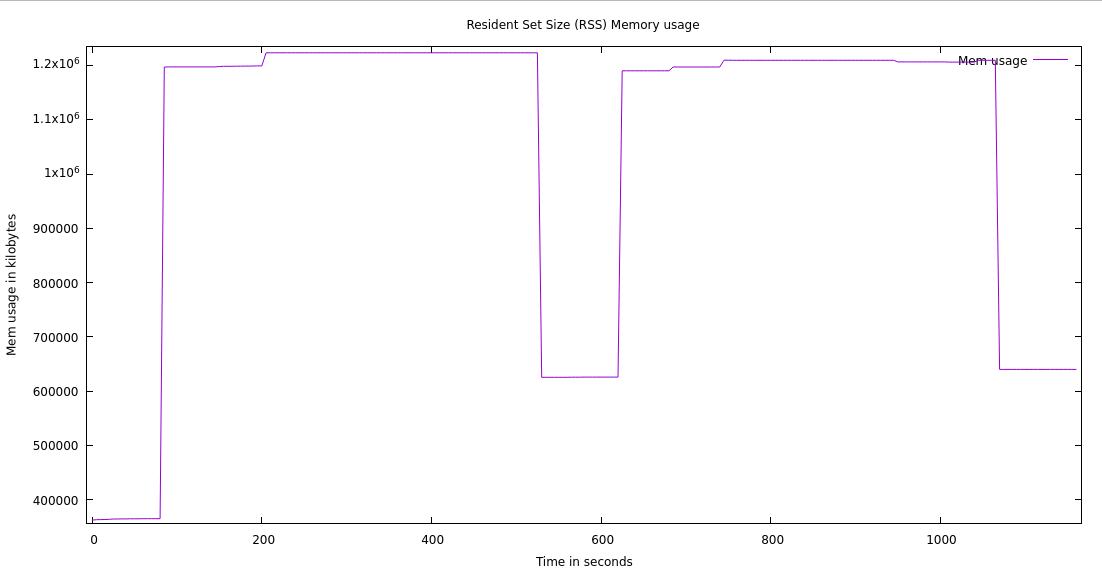
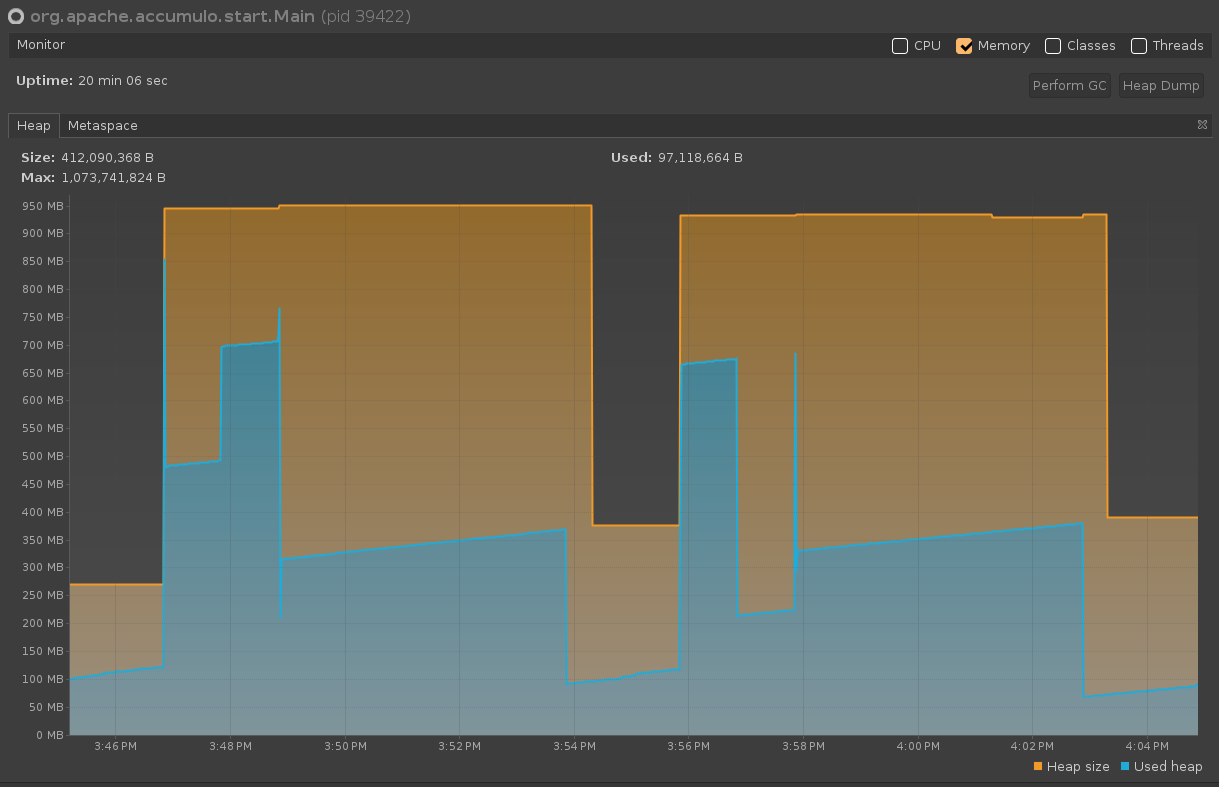
The roughly 100MB of unreturned memory is also present with Shenandoah GC in Java 17 and Java 21 but does not appear to be present with Java 11. With ZGC, however, we see several runs where nearly all the memory used during a compaction is returned to the OS (the graph below was from a run using ZGC with Java 21). These findings regarding the unreturned memory may or may not be significant. They may also be the result of variance between runs. More testing would need to be done to confirm or deny these claims.
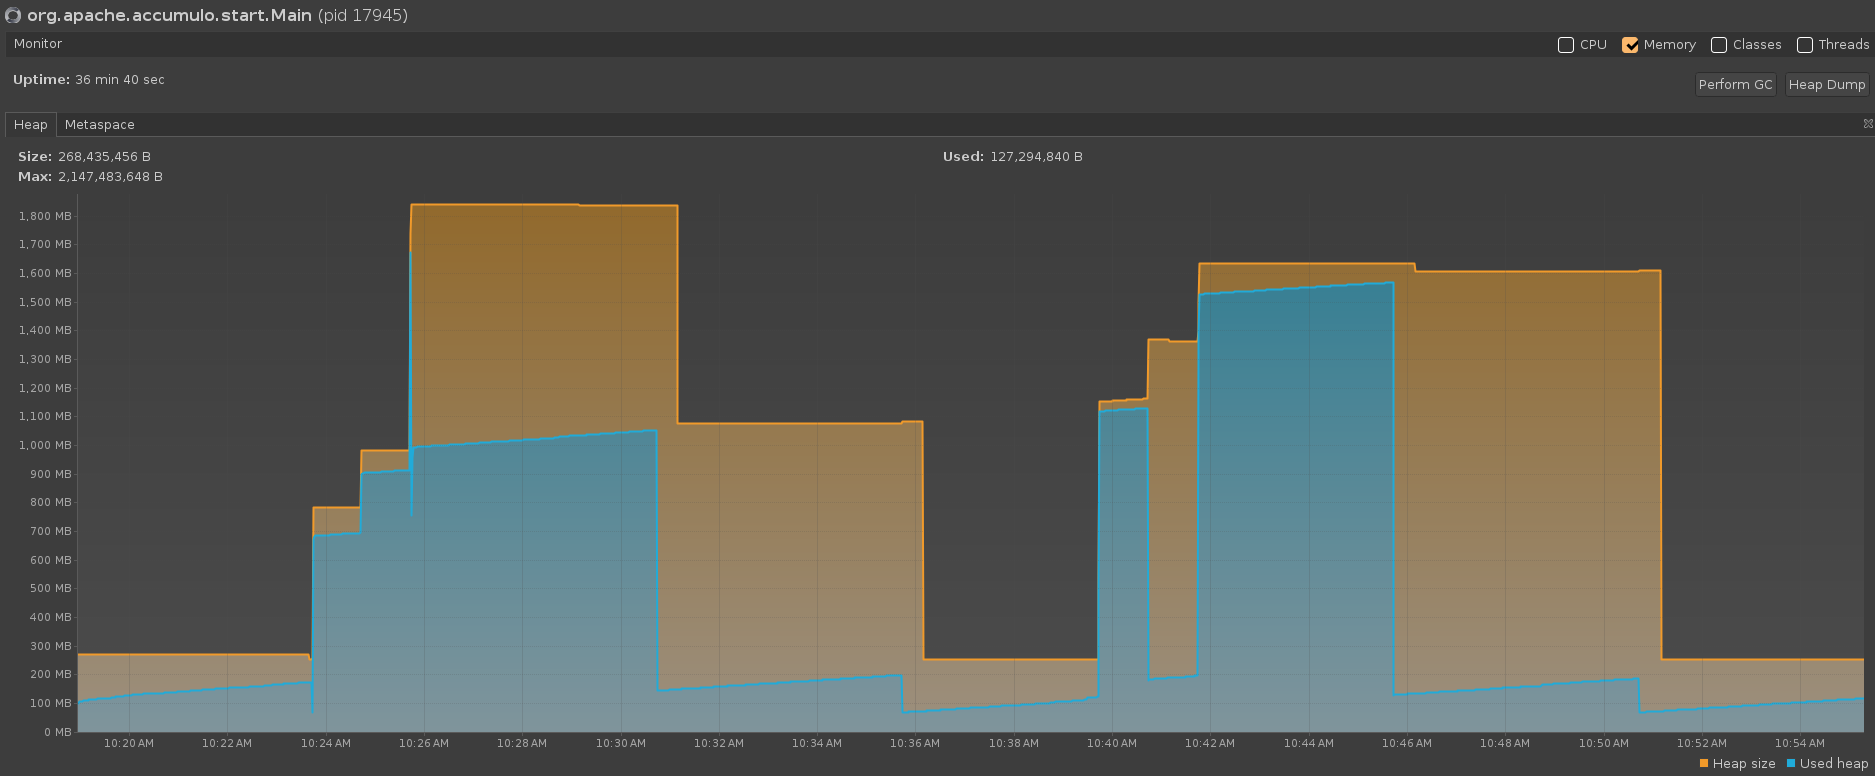
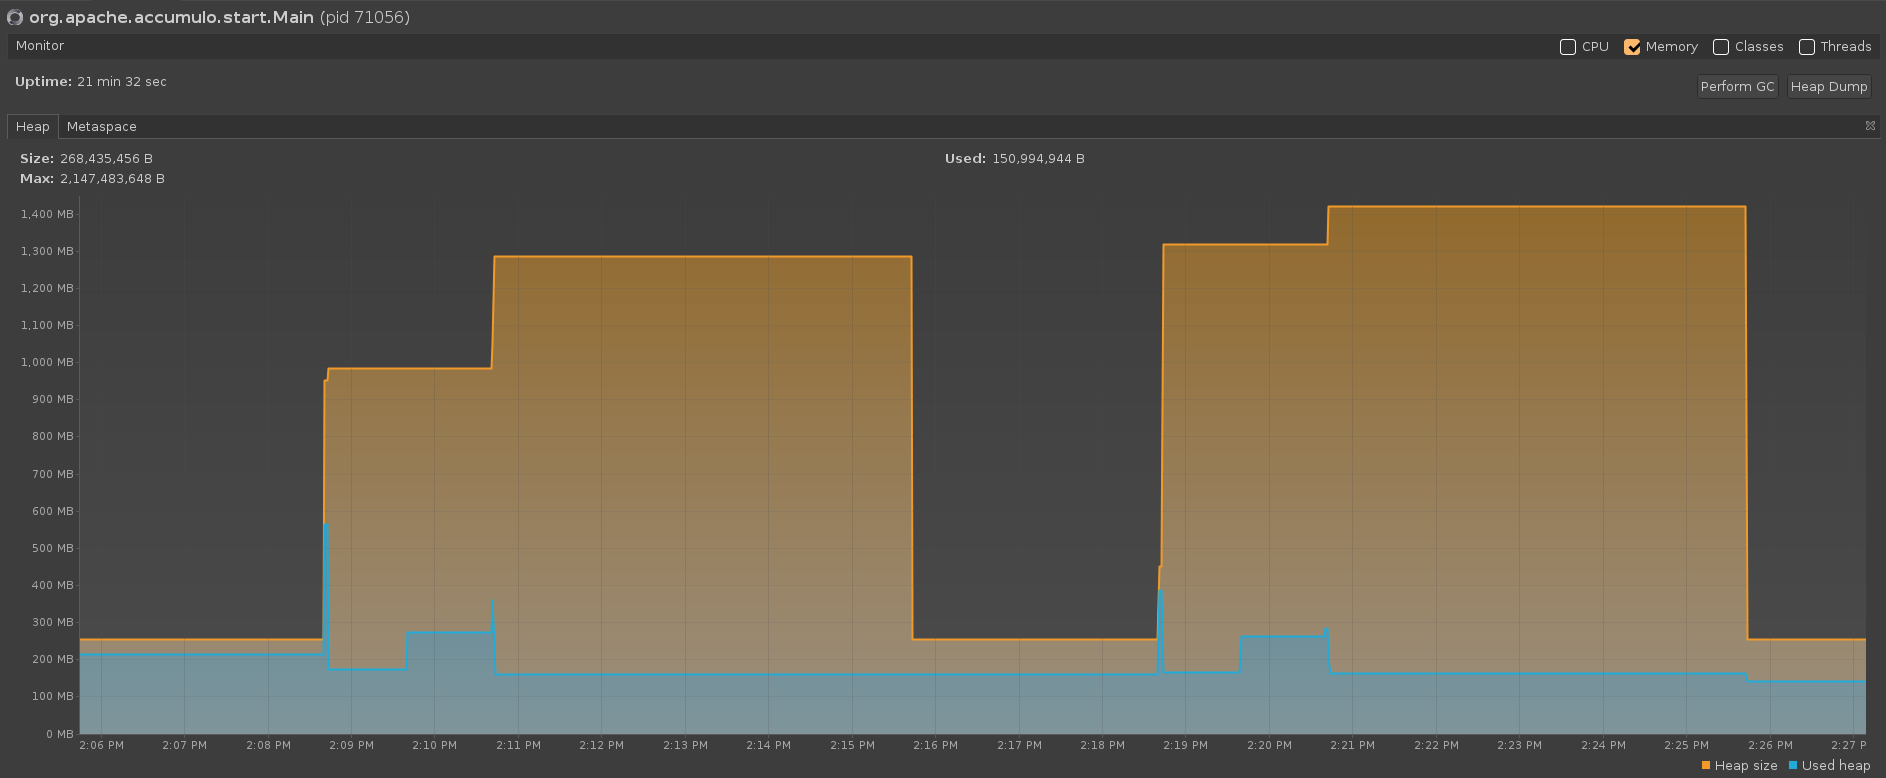
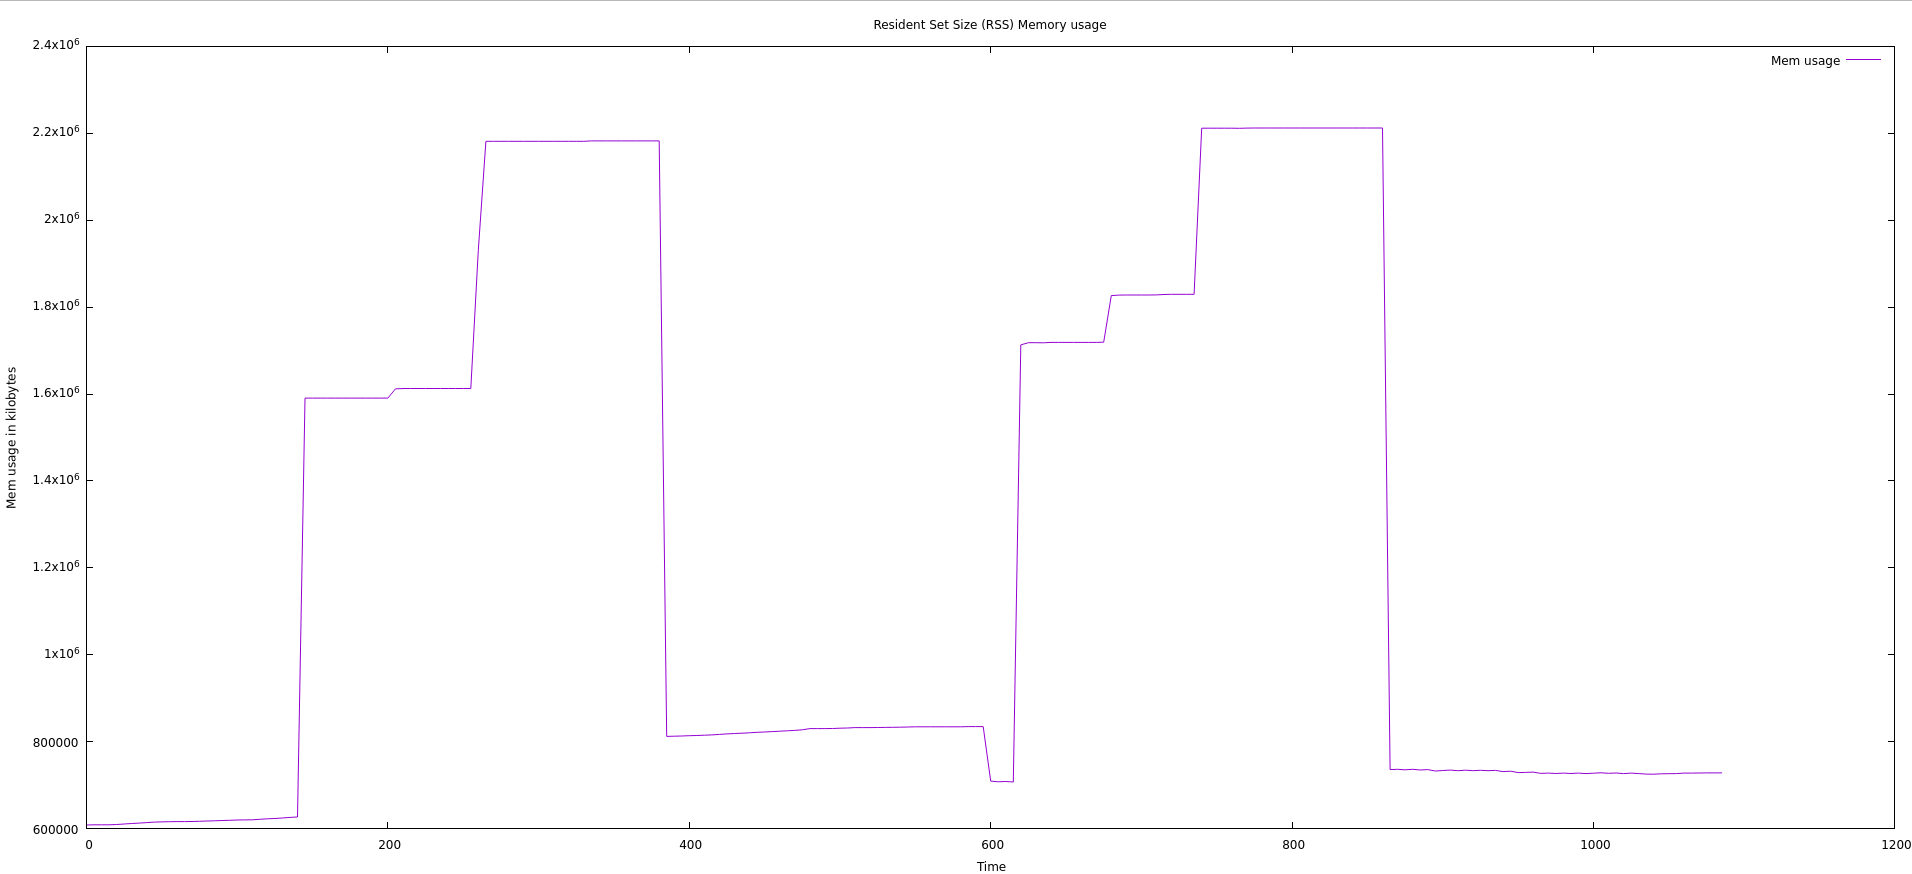
Another interesting finding was that the processes use more memory when more is allocated. These results were obtained from initiating a compaction of 700MB of data (see experiment.jsh script). For example, setting 2GB versus 1GB of max heap for the compactor process results in a higher peak memory usage. During a compaction, when only allocated 1GB of heap space, the max heap space is not completely utilized. When allocated 2GB, compactions exceed 1GB of heap space used. It appears that G1 GC and ZGC use the least amount of heap space during a compaction (maxing out around 1.5GB and when using ZGC with ZGeneration in Java 21, this maxes out around 1.7GB). Shenandoah GC appears to use the most heap space during a compaction with a max heap space around 1.9GB (for Java 11, 17, and 21). However, these differences might be due to differences between outside factors during runs and more testing may need to be done to confirm or deny these claims.
Another difference found between the GCs tested was that Shenandoah GC sometimes required two garbage collections to occur after a compaction completed to clean up the memory. Based on our experiments, when a larger max heap size was allocated (2GB vs 1GB), the first garbage collection that occurred only cleaned up about half of the now unused memory, and another garbage collection had to occur for the rest to be cleaned up. This was not the case when 1GB of max heap space was allocated (almost all of the unused memory was cleaned up on the first garbage collection, with the rest being cleaned up on the next garbage collection). G1 GC and ZGC always cleaned up the majority of the memory on the first garbage collection.
*Note: When using the default GC (G1 GC), garbage collection does not automatically occur unless further garbage collection settings are specified (e.g., G1PeriodicGCInterval)
View all posts in the news archive