2.1.0 Metrics and Tracing Changes
Author: Dave Marion
Date: 22 Jun 2022
Metrics and Tracing changed in 2.1.0. This post explains the new implementations and provides examples on how to configure them.
Metrics
Accumulo was modified in version 1.7.0 (2015) to use the Hadoop Metrics2 framework for capturing and emitting internal Accumulo metrics. Micrometer, a newer metrics framework, supports sending metrics to many popular monitoring systems. In Accumulo 2.1.0 support for the Hadoop Metrics2 framework has been removed in favor of using Micrometer. Metrics are disabled by default.
Micrometer has the concept of a MeterRegistry, which is used to create and emit metrics to the supported monitoring systems. Additionally, Micrometer supports sending metrics to multiple monitoring systems concurrently. Configuring Micrometer in Accumulo will require you to write a small peice of code to provide the MeterRegistry configuration. Specifically, you will need to create a class that implements MeterRegistryFactory. Your implementation will need to create and configure the appropriate MeterRegistry. Additionally, you will need to add the MeterRegistry jar file and the jar file containing your MeterRegistryFactory implementation to Accumulo’s classpath. The page for each monitoring system that Micrometer supports contains instructions on how to configure the registry and which jar file is required.
Accumulo’s metrics integration test uses a TestStatsDRegistryFactory to create and configure a StatsD Meter Registry. The instructions below provide an example of how to use this class to emit Accumulo’s metrics to a Telegraf - InfluxDB - Grafana monitoring stack.
Metrics Example
This example uses a Docker container that contains Telegraf-InfluxDB-Grafana system. We will configure Accumulo to send metrics to the Telegraf component running in the Docker image. Telegraf will persist the metrics in InfluxDB and then we will visualize the metrics using Grafana. This example assumes that you have installed Docker (or equivalent engine) and have an Accumulo database already installed and initialized. We will be installing some things, modifying the Accumulo configuration, and starting Accumulo.
- Download the Telegraf-Influx-Grafana (TIG) Docker image
docker pull artlov/docker-telegraf-influxdb-grafana:latest - Create directories for the Docker container
mkdir -p /tmp/metrics/influxdb chmod 777 /tmp/metrics/influxdb mkdir /tmp/metrics/grafana mkdir /tmp/metrics/grafana-dashboards mkdir -p /tmp/metrics/telegraf/conf - Download Telegraf configuration and Grafana dashboard
cd /tmp/metrics/telegraf/conf wget https://raw.githubusercontent.com/apache/accumulo-testing/main/contrib/terraform-testing-infrastructure/modules/config-files/templates/telegraf.conf.tftpl cat telegraf.conf.tftpl | sed "s/\${manager_ip}/localhost/" > telegraf.conf cd /tmp/metrics/grafana-dashboards wget https://raw.githubusercontent.com/apache/accumulo-testing/main/contrib/terraform-testing-infrastructure/modules/config-files/files/grafana_dashboards/accumulo-dashboard.json wget https://raw.githubusercontent.com/apache/accumulo-testing/main/contrib/terraform-testing-infrastructure/modules/config-files/files/grafana_dashboards/accumulo-dashboard.yaml - Start the TIG Docker container
docker run --ulimit nofile=66000:66000 -d --rm \ --name tig-stack \ -p 3003:3003 \ -p 3004:8888 \ -p 8086:8086 \ -p 22022:22 \ -p 8125:8125/udp \ -v /tmp/metrics/influxdb:/var/lib/influxdb \ -v /tmp/metrics/grafana:/var/lib/grafana \ -v /tmp/metrics/telegraf/conf:/etc/telegraf \ -v /tmp/metrics/grafana-dashboards:/etc/grafana/provisioning/dashboards \ artlov/docker-telegraf-influxdb-grafana:latest - Download Micrometer StatsD Meter Registry jar
wget -O micrometer-registry-statsd-1.9.1.jar https://search.maven.org/remotecontent?filepath=io/micrometer/micrometer-registry-statsd/1.9.1/micrometer-registry-statsd-1.9.1.jar - At a mininum you need to enable the metrics using the property
general.micrometer.enabledand supply the name of the MeterRegistryFactory class using the propertygeneral.micrometer.factory. To enable JVM metrics, use the propertygeneral.micrometer.jvm.metrics.enabled. Modify the accumulo.properties configuration file by adding the properties below.# Micrometer settings general.micrometer.enabled=true general.micrometer.jvm.metrics.enabled=true general.micrometer.factory=org.apache.accumulo.test.metrics.TestStatsDRegistryFactory -
Copy the micrometer-registry-statsd-1.9.1.jar and accumulo-test.jar into the Accumulo lib directory
- The TestStatsDRegistryFactory uses system properties to determine the host and port of the StatsD server. In this example the Telegraf component started in step 4 above contains a StatsD server listening on localhost:8125. Configure the TestStatsDRegistryFactory by adding the following system properties to the JAVA_OPTS variable in accumulo-env.sh.
"-Dtest.meter.registry.host=127.0.0.1" "-Dtest.meter.registry.port=8125" - Start Accumulo. You should see the following statement in the server log files
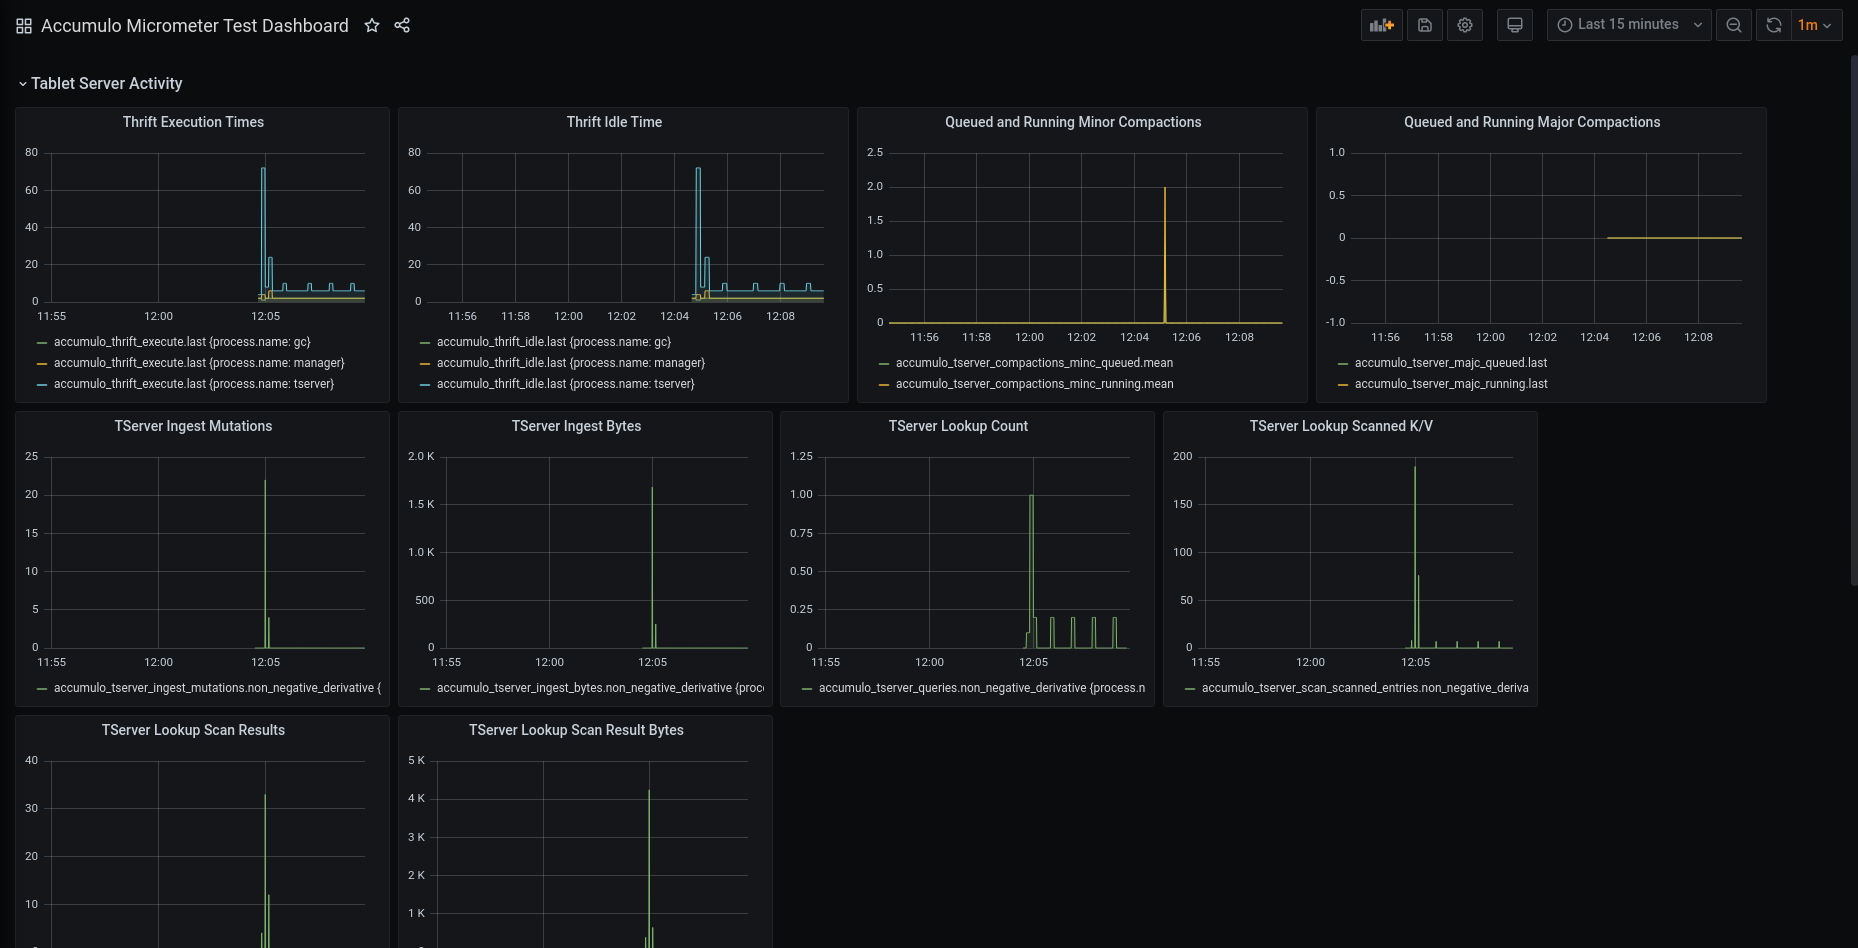
[metrics.MetricsUtil] INFO : initializing metrics, enabled:true, class:org.apache.accumulo.test.metrics.TestStatsDRegistryFactory - Log into Grafana (http://localhost:3003/) using the default credentials (root/root). Click the
Homeicon at the top, then click theAccumulo Micrometer Test Dashboard. If everything is working correctly, then you should see something like the image below.
Tracing
With the retirement of HTrace, Accumulo has selected to replace it’s tracing functionality with OpenTelemetry in version 2.1.0. Hadoop appears to be on the same path which, when finished, should provide better insight into Accumulo’s use of HDFS. OpenTelemetry supports exporting Trace information to several different systems, to include Jaeger, Zipkin, and others. The HTrace trace spans in the Accumulo source code have been updated to use OpenTelemetry trace spans. If tracing is enabled, then Accumulo will use the OpenTelemetry implementation registered with the GlobalOpenTelemetry object. Tracing is disabled by default and a no-op OpenTelemetry implementation is used.
Tracing Example
This example uses the OpenTelemetry Java Agent jar file to configure and export trace information to Jaeger. The OpenTelemetry Java Agent jar file bundles together the supported Java exporters, provides a way to configure them, and registers them with the GlobalOpenTelemetry singleton that is used by Accumulo. An alternate method to supplying the OpenTelemetry dependencies, without using the Java Agent jar file, is to create a shaded jar with the OpenTelemetry autoconfigure module and it’s runtime dependencies and place the resulting shaded jar on the classpath. An example Maven pom.xml file to create the shaded jar is here. When using this alternate method you can skip step 2 and the uncommenting of the java agent in step 5 below.
- Download Jaeger all-in-one Docker image
docker pull jaegertracing/all-in-one:1.35 - Download OpenTelemetry Java Agent (https://github.com/open-telemetry/opentelemetry-java/tree/main/sdk-extensions/autoconfigure)
wget -O opentelemetry-javaagent-1.15.0.jar https://search.maven.org/remotecontent?filepath=io/opentelemetry/javaagent/opentelemetry-javaagent/1.15.0/opentelemetry-javaagent-1.15.0.jar - To enable tracing, you need to set the
general.opentelemetry.enabledproperty. Modify the accumulo.properties configuration file and add the following property.# OpenTelemetry settings general.opentelemetry.enabled=trueNote: If you are using Accumulo 2.1.4 or newer, skip steps 4-5 below and follow the updated instructions in the Updated Configuration with Newer Versions of OpenTelemetry section.
- Configure the OpenTelemetry JavaAgent in accumulo-env.sh by uncommenting the following and updating the path to the java agent jar:
## Optionally setup OpenTelemetry SDK AutoConfigure ## See https://github.com/open-telemetry/opentelemetry-java/tree/main/sdk-extensions/autoconfigure #JAVA_OPTS=('-Dotel.traces.exporter=jaeger' '-Dotel.metrics.exporter=none' '-Dotel.logs.exporter=none' "${JAVA_OPTS[@]}") ## Optionally setup OpenTelemetry Java Agent ## See https://github.com/open-telemetry/opentelemetry-java-instrumentation for more options #JAVA_OPTS=('-javaagent:path/to/opentelemetry-javaagent.jar' "${JAVA_OPTS[@]}") - Start Jaeger Docker container
docker run -d --rm --name jaeger \ -e COLLECTOR_ZIPKIN_HOST_PORT=:9411 \ -p 5775:5775/udp \ -p 6831:6831/udp \ -p 6832:6832/udp \ -p 5778:5778 \ -p 16686:16686 \ -p 14268:14268 \ -p 14250:14250 \ -p 9411:9411 jaegertracing/all-in-one:1.35 - Start Accumulo. You should see the following statement in the server log files
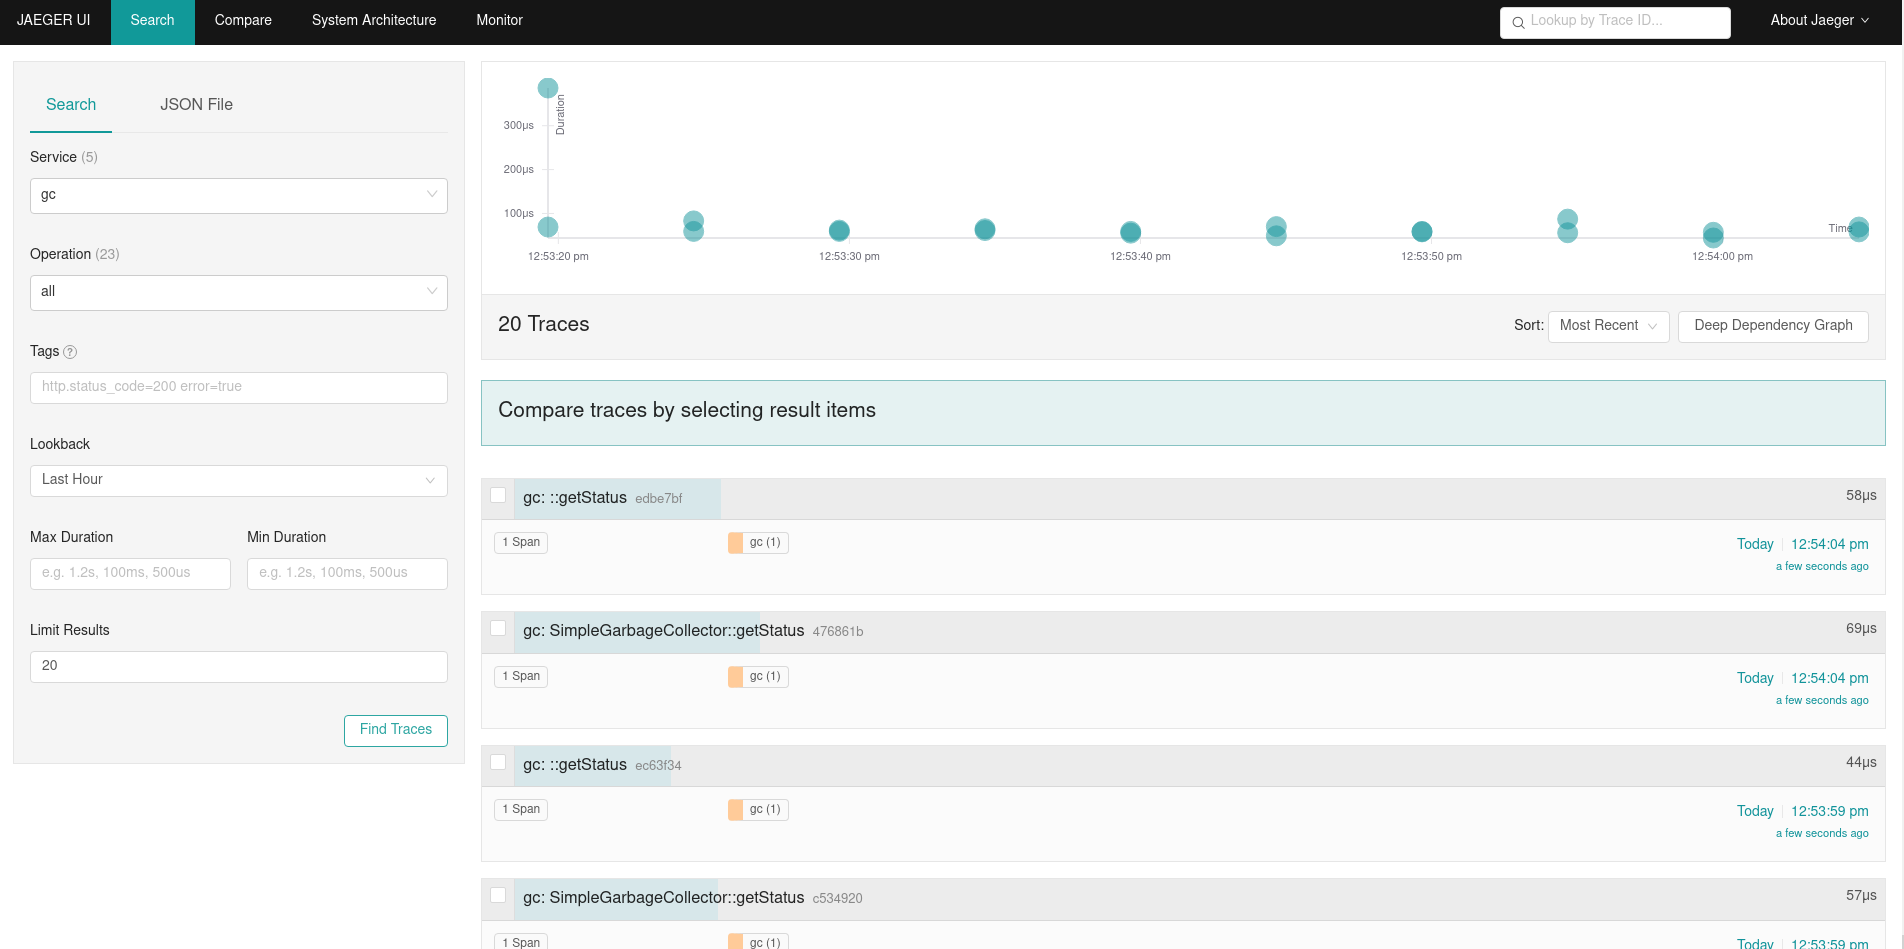
[trace.TraceUtil] INFO : Trace enabled in Accumulo: yes, OpenTelemetry instance: class io.opentelemetry.javaagent.instrumentation.opentelemetryapi.v1_10.ApplicationOpenTelemetry110, Tracer instance: class io.opentelemetry.javaagent.instrumentation.opentelemetryapi.trace.ApplicationTracer - View traces in Jaeger UI at http://localhost:16686. You can select the service name on the left panel and click
Find Tracesto view the trace information. If everything is working correctly, then you should see something like the image below.
Updated Configuration with Newer Versions of OpenTelemetry
The original tracing example above was written for Accumulo 2.1.0 which uses OpenTelemetry 1.19.0. Accumulo 2.1.4 has been updated to use OpenTelemetry 1.48.0, which requires different configuration. When working with Accumulo 2.1.4 or any deployment using OpenTelemetry 1.48.0 or newer, use OTLP (OpenTelemetry Protocol) instead of the direct Jaeger exporter.
Follow steps 1–3 from the Tracing Example section, then use these updated steps in place of steps 4-5:
- Configure the OpenTelemetry JavaAgent in accumulo-env.sh with OTLP export:
JAVA_OPTS=('-Dotel.traces.exporter=otlp' '-Dotel.exporter.otlp.endpoint=http://localhost:4317' '-Dotel.metrics.exporter=none' '-Dotel.logs.exporter=none' "${JAVA_OPTS[@]}") JAVA_OPTS=('-javaagent:path/to/opentelemetry-javaagent.jar' "${JAVA_OPTS[@]}") - Start Jaeger with OTLP support:
docker run --rm --name jaeger \
  -p 16686:16686 \
  -p 4317:4317 \
  -p 4318:4318 \
  -p 5778:5778 \
  -p 9411:9411 \
  jaegertracing/jaeger:2.3.0
After completing these updated steps, continue with steps 7-8 from the original instructions to view traces in Jaeger.
View all posts in the news archive