Security Performance Implications
Date: 06 Mar 2017
The purpose of this two part series was to measure the performance impact of various security configurations on a cluster running Apache Accumulo’s continuous ingest suite. The tests were performed using Amazon Web Services (AWS), Hortonworks Data Platform 2.4 and Accumulo 1.7. Each of the five different security settings in Accumulo 1.7 was tested including no security, SSL, and SASL with Kerberos authentication for the three quality of protection levels (auth, auth-int, auth-conf). KDC was MIT. HDFS was configured to use Kerberos for authentication and had service level authorization on. Other than that, no other security settings (HTTPS, RPC protection, data transfer encryption, etc) were enabled. Timely was a separate, single node HDFS/Zookeeper/Accumulo instance.
Intro
All runs utilized the continuous ingest suite that ships with Accumulo (a standard method to measure performance in Accumulo). It generates random graph data and inserts it into Accumulo, creating a long linked list of entries. Part 1 was run with just continuous ingest.
Based on the test results, there was a measurable performance impact as each additional security configuration was put in place.
Methodology
We ran 5 tests, one for each security configuration. Each iteration of each test inserted 2 billion entries. Batch writers were configured with 500K max mem to artificially inflate the overall write overhead. This was performed on a small cluster on AWS.
Each test used one of the following security configurations:
- No security - Default
- Two way SSL
- Kerberos/SASL with auth
- auth is just Kerberos authentication between client and server. Each end of the RPC definitively knows who the other is.
- Kerberos/SASL with auth-int
- Builds on auth, also providing message integrity checks of the data going across the wire. You also know that the message you received was not altered.
- Kerberos/SASL with auth-conf
- Builds on auth-int, also providing confidentiality of the message that was sent to prevent others from reading it (aka wire-encryption).
For each test, five iterations were run to obtain a min, max, and median time elapsed at each security configuration. After each iteration, Hadoop, and Zookeeper processes were restarted, Accumulo tables are wiped clean and tables are recreated. In addition, pagecache, dentries and inodes are dropped by issuing a ‘3’ command on /proc/sys/vm/drop_caches to ensure that the OS is not caching things to disk that might affect the benchmark. The following sequence was performed between iterations:
- Bring down Accumulo
- Bring down Zookeeper
- Bring down Hadoop
- Run sync command
- Drop OS cache
- Bring up Hadoop
- Bring up Zookeeper
- Bring up Accumulo
- Drop tables
- Create tables
For each iteration, the results were stored, fed into Timely, and viewed with Grafana. Since the runs were executed sequentially, the start epochs for each run did not align. To mitigate, the entries for each run were inserted with the same relative epoch for convenient comparison in Grafana.
The table configurations for Accumulo remain the same throughout the different iterations and security levels. The Accumulo site configurations differ only due to the different settings for the security level configurations.
Environment
In order to perform the testing, a small AWS cluster was setup using 14 hosts on EC2. Two i2.xlarge instances were used as master nodes and eight d2.xlarge instances were used for workers. In addition, two c4.4xlarge instances were used for ingesters, one m4.2xlarge instance was used for Timely, and one m4.xlarge instance was used for Apache Ambari. A logical diagram of the setup is depicted below:
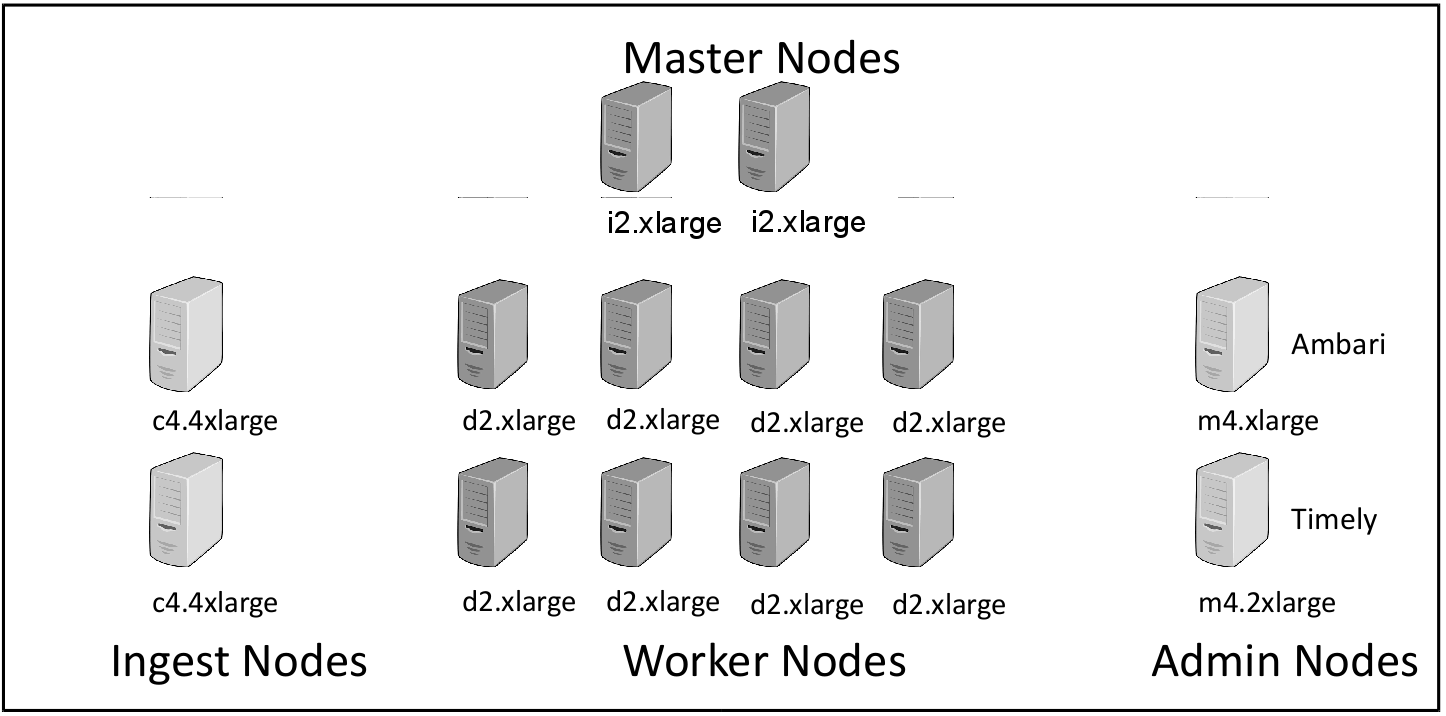
Figure 1 - Cluster Layout, Roles, and Instance Types on AWS.
The types of nodes and their function are given below:
| Node Type | AWS EC2 Type | EC2 Type Details | Quantity |
|---|---|---|---|
| Ingest Nodes | c4.4xlarge | 16 core, 30 GB RAM | 2 |
| Worker Node | d2.xlarge | 4 cores, 30.5 GB RAM, 3x2T GB HD | 8 |
| Master Node | i2.xlarge | 4 cores, 30.5 GB RAM, 1x800GB SSD | 2 |
| Admin Node | m4.xlarge | 4 cores, 16 GB RAM | 1 |
| Timely Node | m4.2xlarge | 8 cores, 32 GB RAM | 1 |
Table 1 – AWS Instance Types, Role, Details, and Quantities
Results
The median, max, and min of the milliseconds elapsed time of all iterations for each test is displayed below. The percentage change columns compare the Median, Max, and Min respectively from the no security level to each security configuration (e.g. no security Median vs. auth-int Median, no security Max vs. auth-int Max).
| Security Level | Median | Standard Deviation | Max | Min | % Change (nosec Median vs. Median) | % Change (nosec Max vs. Max) | % Change (nosec Min vs. Min) | Delta from Previous Level (Median) |
|---|---|---|---|---|---|---|---|---|
| no security | 7829394 | 139340 | 8143035 | 7764309 | 0.00% | 0.00% | 0.00% | 0.00% |
| ssl | 8292760 | 87012 | 8464060 | 8204955 | 5.92% | 3.94% | 5.68% | 5.92% |
| auth | 8859552 | 134109 | 9047971 | 8657618 | 13.16% | 11.11% | 11.51% | 6.83% |
| auth-int | 9500737 | 155968 | 9753424 | 9282371 | 21.34% | 19.78% | 19.55% | 7.24% |
| auth-conf | 9479635 | 170823 | 9776580 | 9282189 | 21.08% | 20.06% | 19.55% | -0.22% |
Table 2 – Summarized Time Elapsed for Each Security Level
Plots
Below are some snapshots of *stats.out elements via Grafana that were inserted into Timely with the same relative start time. Each graph represents a field in the output generated by ContinuousStatsCollector
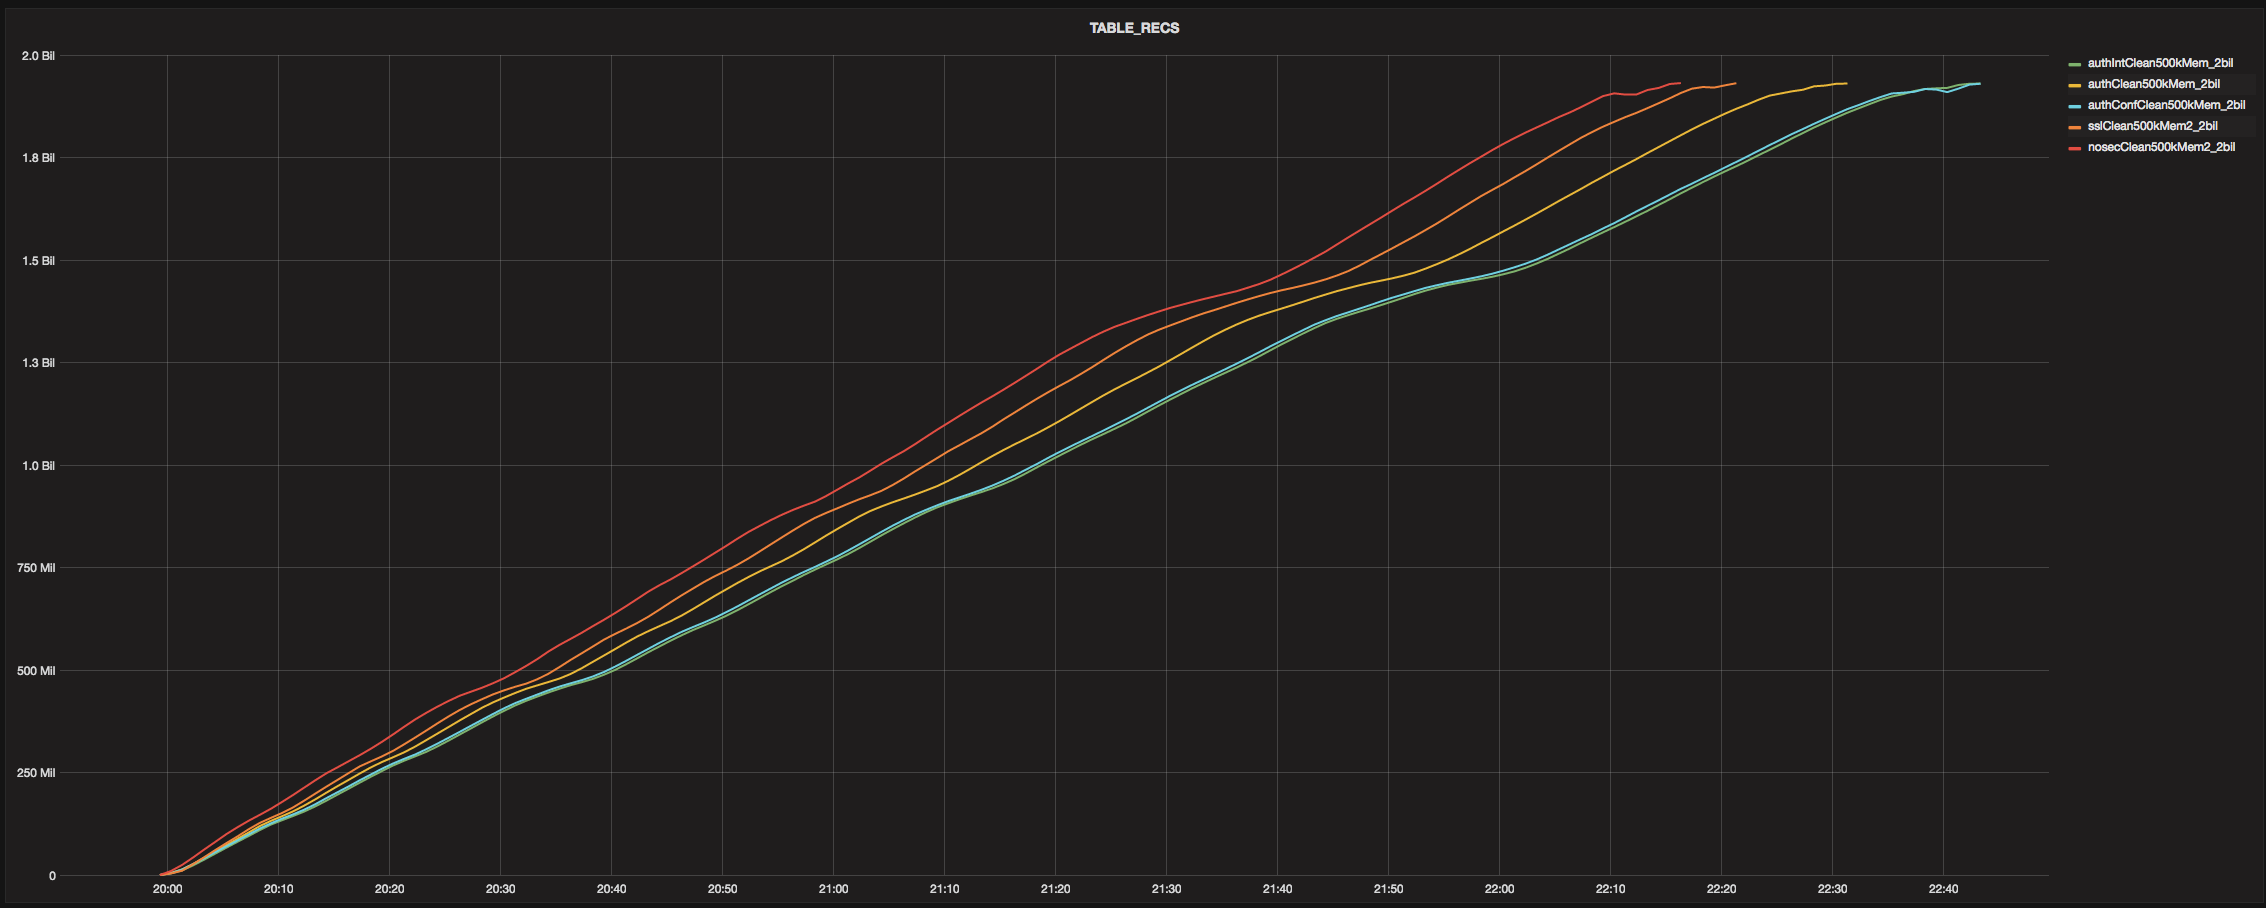
TABLE_RECS
(Number of records in the continuous ingest table. Down sample=1m, aggregate=avg)
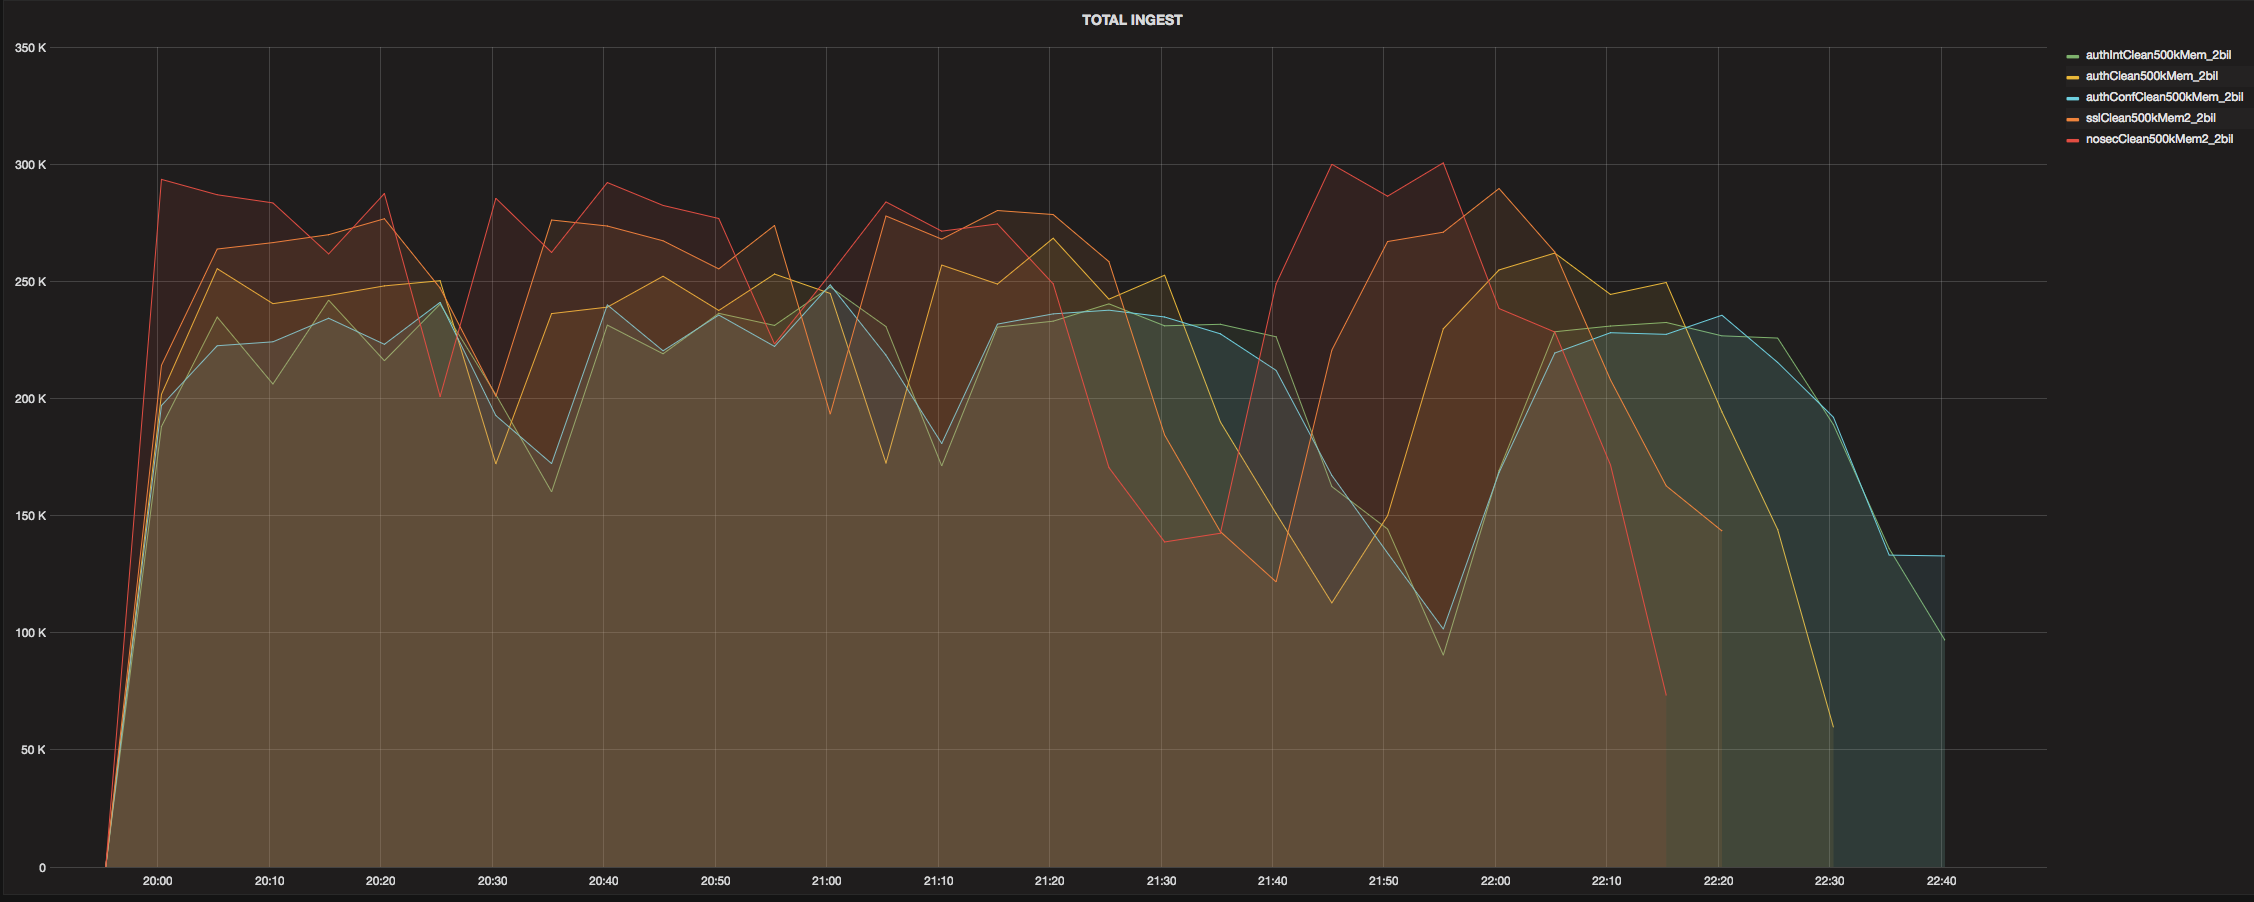
TOTAL_INGEST
(Ingest rate for Accumulo instance. Down sample=5m, aggregate=avg)
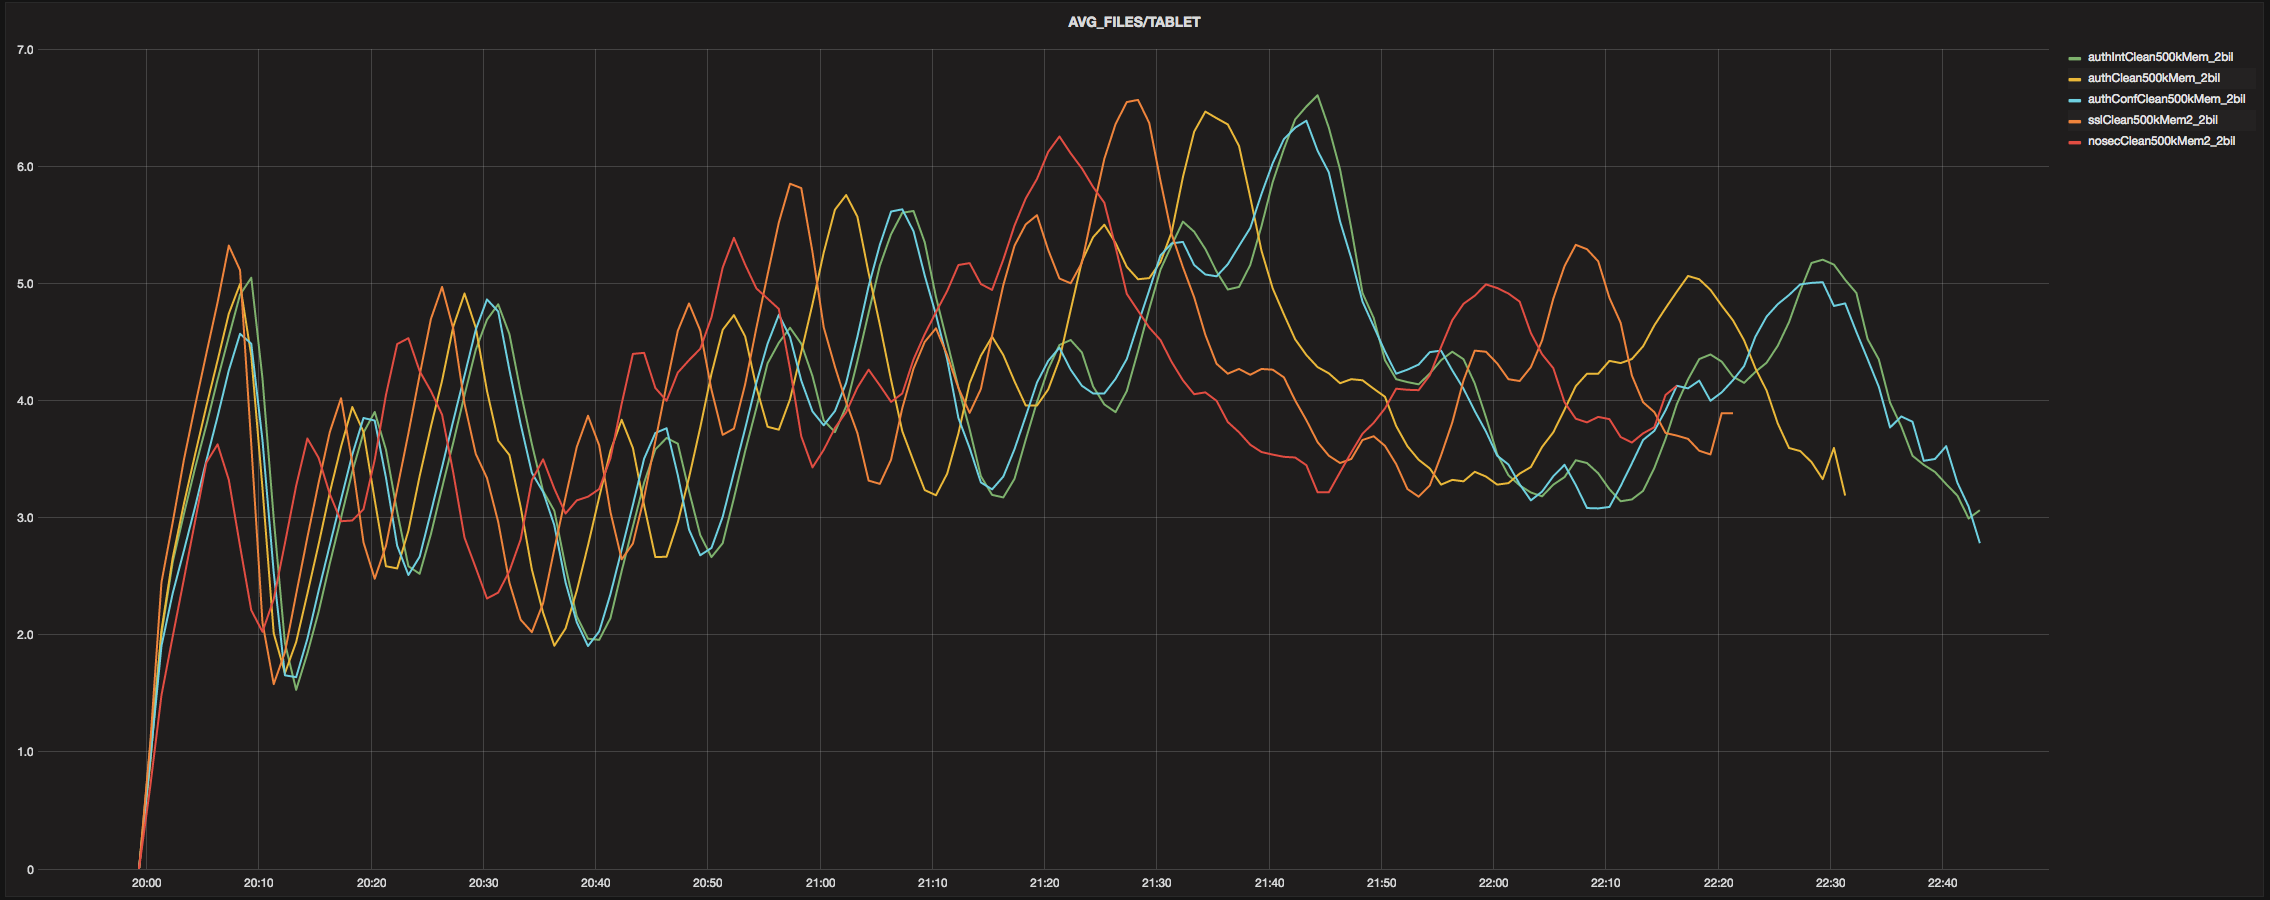
AVG_FILES/TABLET
(Average number of files per Accumulo tablet. Down sample=1m, aggregate=avg)
ACCUMULO_FILES
(Total number of files for Accumulo. Down sample=1m, aggregate=avg)
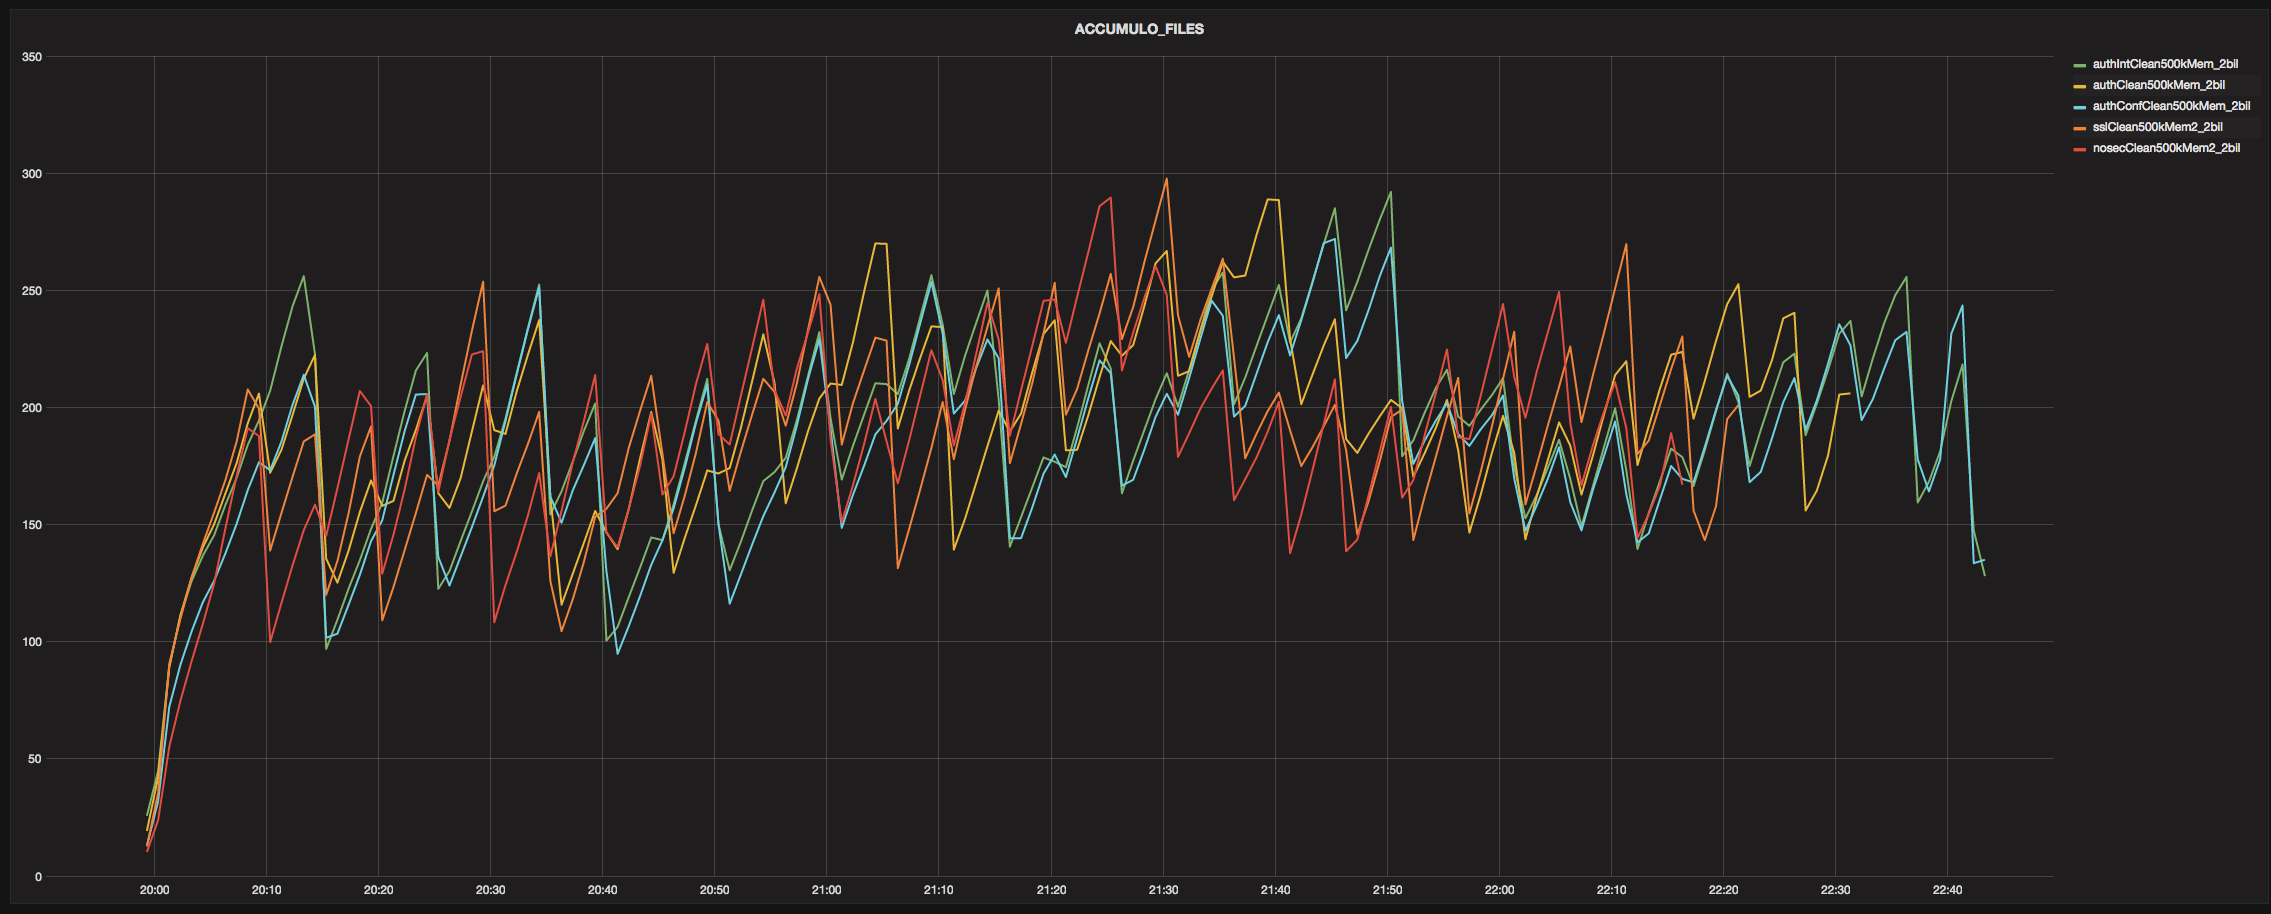
As can be seen in the plots above, the different security settings have relatively consistent, discernible median run characteristics. The big dip in each TOTAL_INGEST coincides with a large number of major compactions, a rate decrease for TABLE_RECS, and a decrease in AVG_FILES/TABLET.
Final Thoughts
The biggest performance hits to run duration median (compared to default security) were ~21% for auth-int and auth-conf. Interesting to note that SSL’s median run duration was lower than all SASL configs and that auth-conf’s was lower than auth-int. Initial speculation for these oddities revolved around the Thrift server implementations, but the Thrift differences will not explain the auth-conf/int disparity since both utilize TThreadPoolServer. It was certainly unexpected that the addition of wire encryption would yield a faster median run duration. This result prompted, as a sanity check, sniffing the net traffic (in a contrived example not during a timed run) in both auth-conf and auth-int to ensure that the message contents were actually obfuscated in auth-conf (they were) and not obfuscated in auth-int (they weren’t).
Future Work
Part 2 of this series will consist of the same continuous ingest loads and configurations with the addition of a query load on the system.
View all posts in the news archive