View Accumulo metrics in Grafana
Date: 22 Mar 2018
The Accumulo monitor provides the easiest way to view Accumulo metrics but it has two limitations:
- The overview page is limited to 10 graphs
- These graphs only show metrics for the past two hours
The Accumulo monitor could be improved to be better a visualization tool for metrics but this doesn’t make sense when tools like Grafana, Graphite, and Ganglia exist and Accumulo can report metrics to these tools using Hadoop Metrics2. While it’s easy to configure Accumulo to send metrics, the hard part is setting up and configuring a metrics visualization tool (i.e Graphite, Ganglia, Grafana/InfluxDB) to collect and view these metrics.
To ease this burden, this post describes how to send Accumulo metrics to InfluxDB, a time series database, and make them viewable in Grafana, a visualization tool.
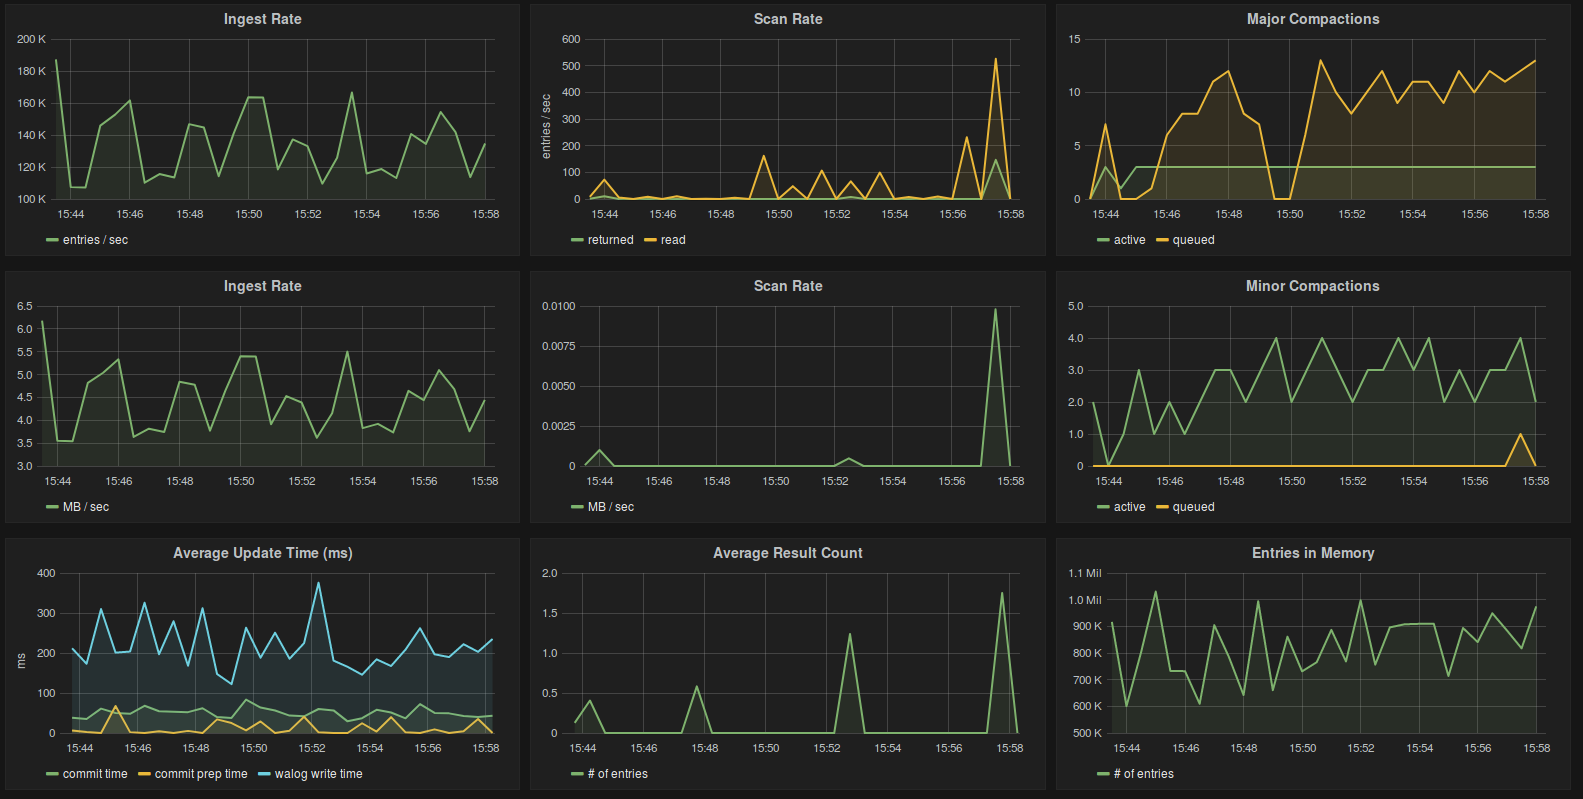
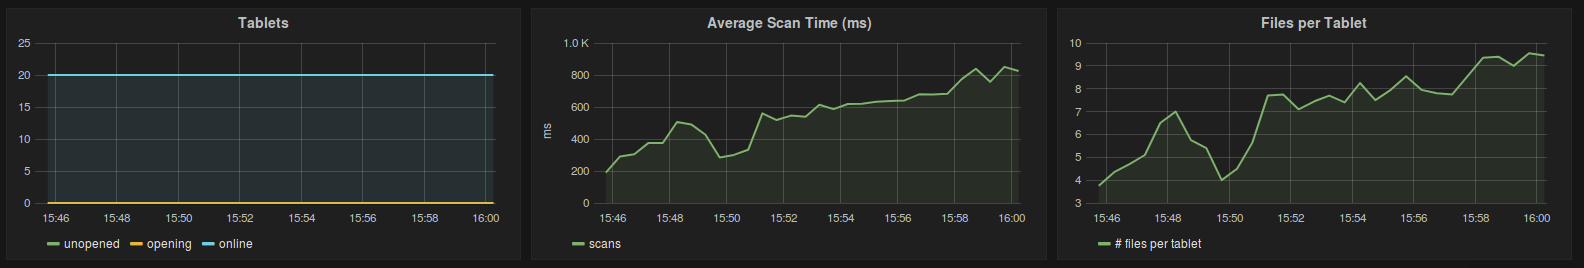
Below is a screenshot of Accumulo metrics in Grafana:
Set up metrics using Uno
Uno can setup and configure InfluxDB/Grafana when it sets up Accumulo using the following command:
uno setup accumulo --with-metrics
Metrics from Accumulo will be immediately viewable in Grafana at http://localhost:3000/.
Set up metrics manually
- Follow the standard installation instructions for InfluxDB and Grafana. As for versions, the instructions below were written using InfluxDB v0.9.4.2 and Grafana v2.5.0.
- Add the following to your InfluxDB configuration to configure it accept metrics in Graphite
format from Accumulo. The configuration below contains templates that transform the Graphite
metrics into a format that is usable in InfluxDB.
[[graphite]] bind-address = ":2003" enabled = true database = "accumulo_metrics" protocol = "tcp" consistency-level = "one" separator = "_" batch-size = 1000 batch-pending = 5 batch-timeout = "1s" templates = [ "accumulo.*.*.*.*.*.*.* measurement.measurement.measurement.d.e.f.host.measurement", "accumulo.*.*.*.*.*.* measurement.measurement.measurement.d.e.host.measurement", "accumulo.*.*.*.*.* measurement.measurement.measurement.d.host.measurement", ] - Configure the Accumulo configuration file
hadoop-metrics2-accumulo.propertiesto send Graphite metrics to InfluxDB. Below is example configuration. Remember to replace<INFLUXDB_HOST>with the actual host.*.period=30 accumulo.sink.graphite.class=org.apache.hadoop.metrics2.sink.GraphiteSink accumulo.sink.graphite.server_host=<INFLUXDB_HOST> accumulo.sink.graphite.server_port=2003 accumulo.sink.graphite.metrics_prefix=accumuloMake sure the reporting frequency is set to 30 sec (i.e
*.period=30). This is required if you are using the provided Grafana dashboards that is configured in the next step. - Grafana needs to be configured to load dashboard JSON templates from a directory. Before restarting
Grafana, you should copy this Accumulo dashboard template to the
dashboards/directory configured below.[dashboards.json] enabled = true path = <GRAFANA_HOME>/dashboards - If you restart Grafana, you will see the Accumulo dashboard configured but all of their charts will be empty unless you have Accumulo running and configured to send data to InfluxDB. When you start sending data, you may need to refresh the dashboard page in the browser to start viewing metrics.
View all posts in the news archive